. 2025 May 23;11(21):eadu2151.
doi: 10.1126/sciadv.adu2151. Epub 2025 May 23.

Single-cell multimodal analysis reveals tumor microenvironment predictive of treatment response in non-small cell lung cancer

Affiliations

Single-cell multimodal analysis reveals tumor microenvironment predictive of treatment response in non-small cell lung cancer

Yuanning Zheng et al. Sci Adv. .

Abstract

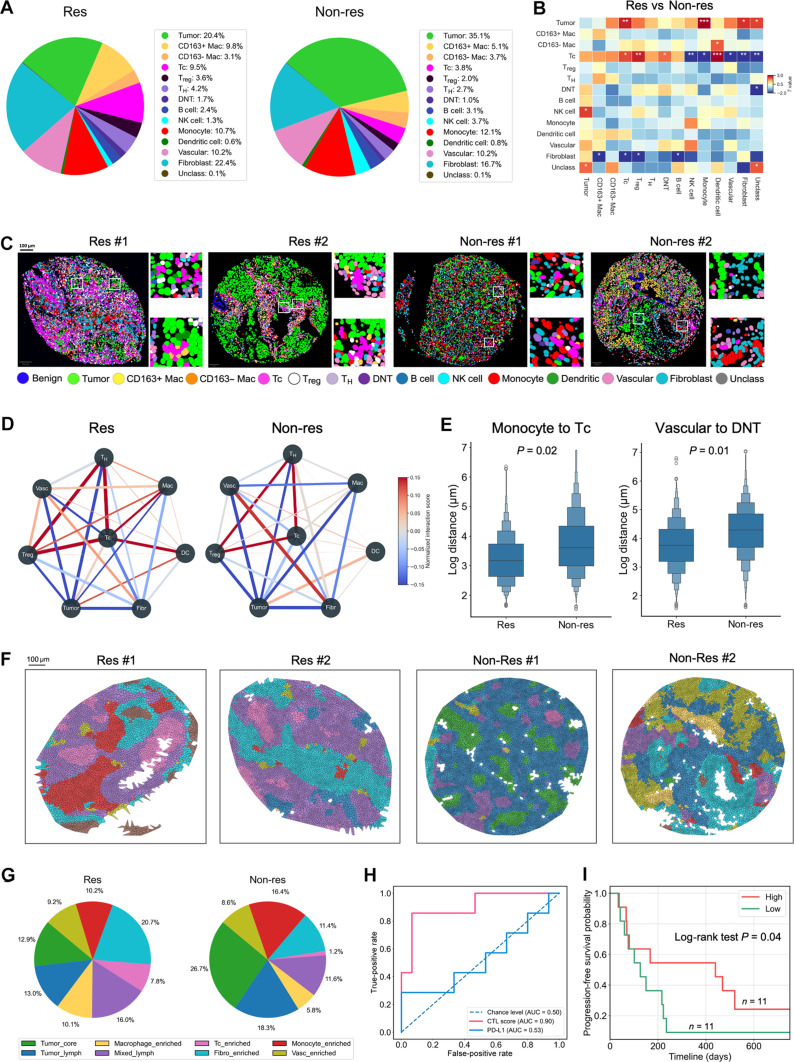
Non-small cell lung cancer (NSCLC) constitutes over 80% of lung cancer cases and remains a leading cause of cancer-related mortality worldwide. Despite the advent of immune checkpoint inhibitors, their efficacy is limited to 27 to 45% of patients. Identifying likely treatment responders is essential for optimizing healthcare and improving quality of life. We generated multiplex immunofluorescence (mIF) images, histopathology, and RNA sequencing data from human NSCLC tissues. Through the analysis of mIF images, we characterized the spatial organization of 1.5 million cells based on the expression levels for 33 biomarkers. To enable large-scale characterization of tumor microenvironments, we developed NucSegAI, a deep learning model for automated nuclear segmentation and cellular classification in histology images. With this model, we analyzed the morphological, textural, and topological phenotypes of 45.6 million cells across 119 whole-slide images. Through unsupervised phenotype discovery, we identified specific lymphocyte phenotypes predictive of immunotherapy response. Our findings can improve patient stratification and guide selection of effective therapeutic regimens.


Figures

Fig. 1.
Fig. 1.. Characterize NSCLC tissue microenvironment using mIF imaging.
(A) Schematic representation of the mIF assay. Selected tumor regions were arranged into TMAs. Tissues were stained with a panel of 33 antibodies, and the immunofluorescence signals were captured for each cell. (B) Example regions with cell-type annotations and corresponding immunofluorescence signals. (C) Cell-type proportions across tumor tissues (n = 255 cores from 50 patients), organized by histological classification. Cell types are color coded according to (F). (D) Associations between cell-type proportions and clinical features. Color represents the directionality of the clinical variable (rows) in which the cell type (columns) is enriched, whereas the marker size corresponds to the T value. Significant associations are indicated by diamonds, whereas nonsignificant associations (n.s.) are represented by circles. Both T and P values were derived from an LMEM, with cell-type proportions as the dependent variable, clinical features as a fixed effect, and patients as a random effect. (E) Representative crops depicting the cell-type composition in each recurrent spatial neighborhood phenotype. Cells are color coded according to (B). (F) Stacked bar graph showing the average cell-type composition across the neighborhoods. (G) Representative tissue core profiles from progressing or nonprogressing tumors. Each cell is color coded by its neighborhood membership according to the legend in (H). (H) Average neighborhood proportions in progressing (n = 153 cores/23 patients) and nonprogressing tumors (n = 66 cores/17 patients). (I) Kaplan-Meier curves depicting progression-free survival for patients with high or low proportions of Tumor_lymph and Macrophage_enriched neighborhoods. Neighborhood proportions from multiple cores were averaged to summarize at the patient level, and the cohort is stratified based on the median proportion. Survival curves were compared using the log-rank test. Mac, macrophage; Tc, cytotoxic T cell; Treg, regulatory T cell; TH, T helper cell, DNT, double-negative T cell; NK, natural killer cell.
Fig. 2.
Fig. 2.. Identify spatial cellular phenotypes predictive of immunotherapy response.
(A) Average cell-type proportions in tumors from responders (n = 25 cores/7 patients) and nonresponders (n = 127 cores/15 patients). (B) T values comparing cell-type interaction scores between tumors from responders and nonresponders. Red indicates that cell_type_A (x axis) interacts more frequently with cell_type_B (y axis) in responders. T and P values are calculated using an LMEM, with interaction score as the dependent variable, treatment response as a fixed effect, and patients as a random effect. *P < 0.05; **P < 0.01; ***P < 0.001. (C) Representative tissue core profiles in tumors from responders and nonresponders. (D) Network visualization of the average cell-type (nodes) interaction scores in tumors from responders and nonresponders. Interaction scores (edges) were normalized to a range from −0.15 to 0.15. (E) Comparing cell-type distance in tumors from responders and nonresponders. P values were calculated using an LMEM, with nucleus centroid distance as the dependent variable, treatment response as a fixed effect, and patients as a random effect. (F) Representative tissue core profiles from responders or nonresponders. Cells are color coded based on neighborhood membership according to (G). (G) Average neighborhood proportions in tumors from responders (n = 25 cores/7 patients) and nonresponders (n = 127 cores/15 patients). (H) ROC curves showing the performance of the CTL scores and PD-L1 immunofluorescence signals in identifying immunotherapy responders (n = 22 patients/7 responders). Scores from multiple cores per patient were aggregated using the median. (I) Kaplan-Meier curves showing the progression-free survival for patients with high or low CTL scores. The cohort is stratified based on the median neighborhood proportion, and survival curves were compared using a one-tailed log-rank test. Mac, macrophage; Tc, cytotoxic T cell; Treg, regulatory T cell; TH, T helper cell; DNT, double-negative T cell; NK, natural killer cell.
Fig. 3.
Fig. 3.. Enhanced immunoreactive microenvironments in pretreatment tumors from immunotherapy responders compared to nonresponders.
(A) Fold change in cell-type–specific protein expression levels in tumors from responders compared to nonresponders. (B) Immunofluorescence signals in tumors from responders (top) and nonresponders (bottom). Scale bars, 50 μm. (C) GSEA plots showing the overrepresented biological pathways in tumors from responders (n = 8) compared to nonresponders (n = 20). (D) Circos plot showing the top differentially expressed genes associated with the overrepresented pathways in tumors from responders. (E) Representative tumor regions with short or long spatial distances between Dc and Tc. Distance threshold (80 μm) was determined by the median value across the entire cohort. (F) Log2-transformed gene expression values of CXCL16 and CXCL8 in tumors with short or long spatial distance between Dc and Tc (n = 23 tissues/23 patients per group). (G) Log2 fold change of the signaling strength in samples with short Dc-Tc distances compared to those with long distances (n = 23 tissues/23 patients per group). P values were calculated using a one-tailed Mann-Whitney U test. *P < 0.05; **P < 0.01; ***P < 0.001. (H) Cell-type scores inferred from deconvolution analysis of RNA-seq data in tumors from responders (n = 8 tissues/8 patients) compared to nonresponders (n = 22 tissues/20 patients). For patients with multiple samples, the average score is presented, and P values were calculated using the Mann-Whitney U test. **P < 0.01. (I) Kaplan-Meier curves showing the progression-free survival for patients with high or low CTL scores. The cohort is stratified by the median score, and survival curves were compared using the log-rank test. (J) ROC curves showing the performance of CTL score and PD-L1 IHC scores in identifying immunotherapy responders (n = 28 patients/8 responders). Dc, dendritic cells; Tc, cytotoxic T cells.
Fig. 4.
Fig. 4.. Development of a deep learning model for automated nucleus segmentation and classification using histology images.
(A) Ground truth (top) and predicted (bottom) nuclear types in two example regions of a tumor. Cell nuclei were enclosed by circles and colored by type. (B) Comparison of nuclear segmentation performance between the NucSegAI and the Hover-Net model trained on the CoNSeP dataset. (C) Comparison of cell-type classification performance between the NucSegAI and Hover-CoNSeP models. Macrophages and lymphocytes were combined into the inflammatory class, whereas vascular cells and fibroblasts were combined into the stromal class. F1 scores are presented for each class, along with the micro and weighted averages. (D) Spatial visualization of cell-type distributions in mIF images (left) and those predicted from histology images (right) of two representative TMA cores. Zoomed-in pictures (middle) display regions enclosed by the squares within the main panel. (E) Number of nuclei detected in mIF images and those segmented in paired histology images by different histology-based models (n = 150 images). (F) Histology images show nuclear classification results from three histology-based models within two example regions. Scale bars, 20 μm. (G) Spearman correlation coefficients between nuclear types classified from mIF data and those predicted from paired histology images.
Fig. 5.
Fig. 5.. Identify lymphocyte phenotypes predictive of immunotherapy response from WSIs.
(A) Schematic representation of the sc-MTOP analysis. Created in BioRender. Zheng, E. (2025) https://BioRender.com/hyfdj2h. (B) Representative spatial cellular graphs for each lymphocyte phenotype. Circles represent nuclear centroids, and lines represent edges connecting spatially adjacent cells. (C) Dot plot showing the values of topological features (y axis) averaged across the lymphocytes belonging to each phenotype (x axis). Color represents z-score normalized values, and size represents the proportion of cells with positive values. (D) Proportions of lymphocyte phenotypes across WSIs. (E and F) Spearman’s correlation coefficients between histology-derived lymphocyte phenotype proportions (x axis) and (E) RNA-seq-derived immune cell-type proportions or (F) gene set enrichment scores (y axis) for the same samples. Red indicates a positive correlation, blue indicates a negative correlation, and circle size is proportional to correlation strength (n = 118 tissues/107 patients). *P < 0.05; **P < 0.01; ***P < 0.001. (G) Kaplan-Meier survival curves showing overall survival for patients with high versus low average proportions of Lym2. The cohort is stratified by the median cell proportion (n = 369 patients). (H) Phenotype proportions of lymphocytes in tumors from responders (n = 10 tissues/8 patients) versus nonresponders (n = 24 tissues/22 patients). Box indicates the interquartile range, with the median indicated by the line within the box. When a patient has more than one tissue, the average proportion is shown. P values were determined using the Mann-Whitney U test. *P < 0.05. (I) ROC curves showing the performance of CTL scores and PD-L1 IHC scores in identifying responders from the immunotherapy-treated cohort (n = 30 patients/8 responders). (J) ROC curves illustrate the performance of CTL scores obtained from mIF images, histology images, RNA-seq data, and the fusion of all three modalities in identifying treatment responders (n = 20 patients/6 responders).

References

    1. Oser M. G., Niederst M. J., Sequist L. V., Engelman J. A., Transformation from non-small-cell lung cancer to small-cell lung cancer: Molecular drivers and cells of origin. Lancet Oncol. 16, e165–e172 (2015). - PMC - PubMed
    1. Arriagada R., Bergman B., Dunant A., Le Chevalier T., Pignon J.-P., Vansteenkiste J., International Adjuvant Lung Cancer Trial Collaborative Group , Cisplatin-based adjuvant chemotherapy in patients with completely resected non-small-cell lung cancer. N. Engl. J. Med. 350, 351–360 (2004). - PubMed
    1. al-Kattan K., Sepsas E., Fountain S. W., Townsend E. R., Disease recurrence after resection for stage I lung cancer. Eur. J. Cardiothorac. Surg. 12, 380–384 (1997). - PubMed
    1. Alberts W. M., Follow up and surveillance of the patient with lung cancer: What do you do after surgery? Respirology 12, 16–21 (2007). - PubMed
    1. Zimmermann F. B., Molls M., Jeremic B., Treatment of recurrent disease in lung cancer. Semin. Surg. Oncol. 21, 122–127 (2003). - PubMed

MeSH terms

Substances