. 2025 May 23;21(5):e1013083.
doi: 10.1371/journal.ppat.1013083. eCollection 2025 May.

Shedding dynamics of a DNA virus population during acute and long-term persistent infection

Affiliations

Shedding dynamics of a DNA virus population during acute and long-term persistent infection

Sylvain Blois et al. PLoS Pathog. .

Abstract

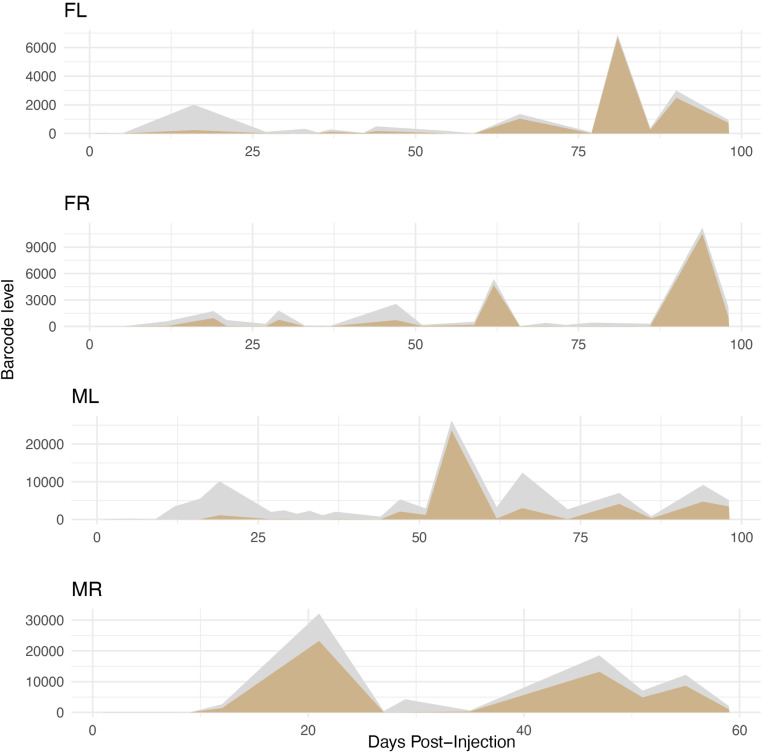
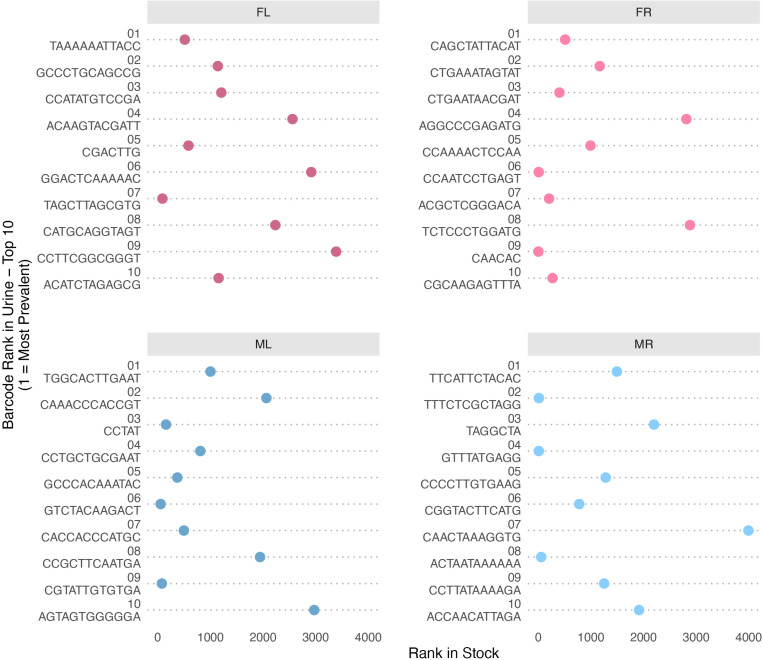
Although much is known of the molecular mechanisms of virus infection within cells, substantially less is understood about within-host infection. Such knowledge is key to understanding how viruses take up residence and transmit infectious virus, in some cases throughout the life of the host. Here, using murine polyomavirus (muPyV) as a tractable model, we monitor parallel infections of thousands of differentially barcoded viruses within a single host. In individual mice, we show that numerous viruses (>2600) establish infection and are maintained for long periods post-infection. Strikingly, a low level of many different barcodes is shed in urine at all times post-infection, with a minimum of at least 80 different barcodes present in every sample throughout months of infection. During the early acute phase, bulk shed virus genomes derive from numerous different barcodes. This is followed by long term persistent infection detectable in diverse organs. Consistent with limited productive exchange of virus genomes between organs, each displays a unique pattern of relative barcode abundance. During the persistent phase, constant low-level shedding of typically hundreds of barcodes is maintained but is overlapped with rare, punctuated shedding of high amounts of one or a few individual barcodes. In contrast to the early acute phase, these few infrequent highly shed barcodes comprise the majority of bulk shed genomes observed during late times of persistent infection, contributing to a stark decrease in bulk barcode diversity that is shed over time. These temporally shifting patterns, which are conserved across hosts, suggest that polyomaviruses balance continuous transmission potential with reservoir-driven high-level reactivation. This offers a mechanistic basis for polyomavirus ubiquity and long-term persistence, which are typical of many DNA viruses.


Conflict of interest statement

The authors have declared that no competing interests exist.

Figures

Fig 1
Fig 1. Total amount of muPyV DNA shed in urine over time.
Urine was collected from infected mice at multiple times post-infection. muPyV genome equivalents per µl of urine as determined by qPCR are shown. Blue circles indicate urine samples selected to determine the barcode repertoire by Illumina NGS. The few selected samples where viral DNA levels were below the limit of quantification (LOQ) are indicated with red circles. Individual mice are identified as “ML”, “MR”, “FL” or “FR”, denoting “M” for male, “F” for female, “L” for left ear punch hole, “R” for right ear punch hole.
Fig 2
Fig 2. Temporal dynamics of unique barcode detection and enrichment over background.
The number of unique barcodes were extracted from Illumina reads for each sample. The number of unique barcodes detected in each mouse over time is plotted. The gray dashed line in each plot represents the in silico control, generated by randomly shuffling the nucleotides in each barcode and then associating them with the stock barcodes to measure background noise. The control barcode counts remained stable across all time points, while the number of unique barcodes in the samples exhibited consistent directional trends (upward or downward) over multiple time points.
Fig 3
Fig 3. Similarity in patterns of barcodes shed at adjacent times post-infection.
The cosine similarity between temporally adjacent time points was plotted to visualize how the relatedness of shed barcode patterns changes over time, overlaid with the amount of total bulk genomes shed per microliter of urine at each time point (gray area). Cosine similarity was calculated between barcode abundance profiles at temporally adjacent time points, comparing the proportional distributions of barcodes independent of absolute viral loads. Note that timepoints with abundant total viral DNA shedding generally have lower cosine similarity scores, consistent with less temporal relatedness when large bulk genome shedding events occur.
Fig 4
Fig 4. Changes in the diversity of shed barcodes over time.
For each time point analyzed, the number of distinct barcodes are plotted on a donut chart with the portion of the circle shaded being proportional to the contribution of that barcode to the overall abundance of bulk barcode DNA present in a sample. Most barcodes are of lower abundance and represented as dark or light gray areas, which take on the appearance of solid gray or alternating stripes. Shading shown in color represents a barcode that was among the top ten most abundant barcodes shed by that mouse over all time points tested. Note, the “9-12 o’clock” region of the plot represents the least abundant barcodes where there are often so many barcodes depicted that the final colors appear a single gray tone. The “12-3 o’clock” region shows the most abundant barcodes for that time point.
Fig 5
Fig 5. Diversity of barcode repertoire decreases after early times of infection.
Shown is the Shannon entropy, which is a measure of complexity (blue line). Shannon entropy captures both the richness (number of barcodes) and evenness (how uniformly barcode abundances are distributed) within the viral population. Overlaid is a plot showing a separate analysis for the number of barcodes it takes to account for 75% of total bulk shed genomes at any single time point (gold). This measure provides a complementary view of diversity by focusing on how many dominant barcodes contribute to the majority of viral DNA at each timepoint. Note, both measures show similar trends of diversity decreasing after the early times post-infection and then stabilizing.
Fig 6
Fig 6. Shedding patterns of the top 30 most abundant individual barcodes found in each mouse during the time course of infection.
Linear ridge plots represent genome equivalent copies of the top 30 most abundant barcodes (“most abundant” determined by greatest amount of a barcode shed at any single time point). The height of an individual peak on the vertical axis correlates to the relative linear abundance of each barcode. The horizontal axis corresponds to different times post-infection when levels of shed muPyV DNA in urine was determined.
Fig 7
Fig 7. The sum of the 10 most abundantly shed barcodes constitutes the majority of bulk shed muPyV DNA in the late phase of persistent infection.
Shown in gold is a ridge plot for each mouse representing the abundance of the sum of the 10 most abundant barcodes shed at each time post-infection (“top 10” determined by the greatest amount of a barcode shed at any single time point). The gray shading represents the sum total bulk virus genomes shed at any particular time point post-infection. For easy comparison, these plots are duplicated on the bottom of S2 Fig.
Fig 8
Fig 8. Rank of the most abundant shed barcodes in the inoculum virus stock.
Shown is the rank in the virus stock of the top 10 most abundant barcodes shed in urine (“top 10” determined by greatest amount of a barcode shed at any single time point). A lower rank (more towards the left side) indicates higher abundance in the virus stock. For each barcode, the number in parentheses shows its corresponding rank among all barcodes shed in urine by that mouse across time-points. Note, the general trend shows that many, but not all, of the most abundant shed barcodes were among those relatively more abundant in the initial inoculum virus stock.
Fig 9
Fig 9. Rank of the most abundant barcodes in assayed mouse tissues in the inoculum stock.
Shown is the rank in the virus inoculum stock of the top 10 most abundant barcodes (“top 10” determined by the greatest amount of a barcode in any tissue for an individual mouse). A lower rank (more towards the left side) indicates higher abundance in the virus stock. Note, similar to what is detected shed in urine, the general trend shows that many, but not all, of the most abundant shed barcodes were among those relatively more abundant in the initial inoculum virus stock.
Fig 10
Fig 10. Low correlation of barcode repertoires amongst different tissues.
Shown is the Spearman correlation coefficient of relative barcode abundance between tissues in each mouse. The top right corner represents the correlation by the size of circle and intensity of the shading between any two organs; the bottom left corner shows the numerical value of Spearman correlation coefficient between different pairs of organs within an individual mouse. These data demonstrate that tissues have unique repertoires of virus genomes, consistent with limited exchange of virus genomes between tissues.

Update of

Similar articles

References

    1. Amato KA, 3rd Haddock LA, Braun KM, Meliopoulos V, Livingston B, Honce R, et al.. Influenza A virus undergoes compartmentalized replication in vivo dominated by stochastic bottlenecks. Nat Commun. 2022;13(1):3416. doi: 10.1038/s41467-022-31147-0 - DOI - PMC - PubMed
    1. Aliota MT, Dudley DM, Newman CM, Weger-Lucarelli J, Stewart LM, Koenig MR, et al.. Molecularly barcoded Zika virus libraries to probe in vivo evolutionary dynamics. PLoS Pathog. 2018;14(3):e1006964. doi: 10.1371/journal.ppat.1006964 - DOI - PMC - PubMed
    1. McCune BT, Lanahan MR, tenOever BR, Pfeiffer JK. Rapid dissemination and monopolization of viral populations in mice revealed using a panel of barcoded viruses. J Virol. 2020;94. - PMC - PubMed
    1. Varble A, Albrecht RA, Backes S, Crumiller M, Bouvier NM, Sachs D, et al.. Influenza A virus transmission bottlenecks are defined by infection route and recipient host. Cell Host Microbe. 2014;16(5):691–700. doi: 10.1016/j.chom.2014.09.020 - DOI - PMC - PubMed
    1. Weger-Lucarelli J, Garcia SM, Rückert C, Byas A, O’Connor SL, Aliota MT, et al.. Using barcoded Zika virus to assess virus population structure in vitro and in Aedes aegypti mosquitoes. Virology. 2018;521:138–48. doi: 10.1016/j.virol.2018.06.004 - DOI - PMC - PubMed

LinkOut - more resources