. 2025 May 21:S0022-202X(25)00488-9.
doi: 10.1016/j.jid.2025.04.033. Online ahead of print.

Cutaneous Lupus Features Specialized Stromal Niches and Altered Retroelement Expression

Affiliations

Cutaneous Lupus Features Specialized Stromal Niches and Altered Retroelement Expression

Jeff R Gehlhausen et al. J Invest Dermatol. .

Abstract

Cutaneous lupus is an inflammatory skin disease causing highly morbid inflamed skin and hair loss. To investigate the pathophysiology of cutaneous lupus, we performed single-cell RNA and spatial sequencing of lesional and nonlesional cutaneous lupus skin compared with that of healthy controls. Pathway enrichment analyses of lesional keratinocytes revealed elevated responses to IFN-I, IFN-II, TNF, and apoptotic signaling. Detailed clustering demonstrated unique fibroblasts specific to lupus skin with likely roles in inflammatory cell recruitment and fibrosis. We also evaluated the association of retroelement expression with IFN-I in the skin. We observed increased retroelement expression that correlated with IFN-stimulated genes across multiple cell types. Moreover, we saw elevated expression of genes involved in RIG-I and cGAS-STING pathways, which transduce elevated nucleic acid signals. Treatment of active cutaneous lupus with anifrolumab reduced RIG-I and cGAS-STING pathways in addition to the most abundant retroelement family, L2b. Our studies better define IFN-I IFN-mediated immunopathology in cutaneous lupus and identify an association between retroelement expression and IFN signatures in cutaneous lupus.

Keywords: Anifrolumab; Cutaneous lupus; Fibroblasts; IFN; Retroelements.


Conflict of interest statement

Conflict of Interest

Disclosures: A.I. co-founded RIGImmune, Xanadu Bio and PanV; and is a member of the Board of Directors of Roche Holding Ltd and Genentech. J.R.G has received research funding support from Bristol Meyers Squibb. The authors declare that these relationships did not influence the design, execution, interpretation, or reporting of the research presented in this manuscript.

Figures
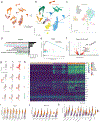
Figure 1:
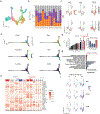
Figure 1:. Single cell RNA sequencing of CLE reveals dominant type I interferon signature.
A) UMAP plot of dataset of healthy control (HC), non-lesional (NL), and lesional (CLE) tissues. B) UMAP showing 11 distinct cell types in dataset. C) Subclustering of Keratinocytes with 8 cell types. D) MSigDB Hallmark Pathway analysis showing the top 10 upregulated pathways in lesional keratinocytes of CLE. E) Gene Set Enrichment Analyses (GSEA) showing enrichment of Interferon Alpha and Gamma pathways in lesional Keratinocytes. F) Volcano Plot of Basal 2 Keratinocyte clusters revealing upregulated interferon and antigen presentation target genes in lesional keratinocytes over controls. G) UMAP plots with overlayed gene signatures on Keratinocyte populations. H) Heatmap of Keratinocyte populations separated by cell type and state with 5 target genes from each signature represented (IFN-I, IFN-II, TNF, and Apoptosis). I, J) Violin plots showing upregulation of ISG15 and IFN-I signature in CLE keratinocytes compared to NL and HC. K) Violin plot of IFN-I signature of all cell types broken down by cell state. UMAP, Uniform Manifold Approximation and Projection.
Figure 2:
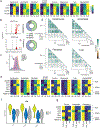
Figure 2:. Cell interaction analysis of stromal and inflammatory cells in CLE.
A) Ligand-Receptor analysis with CellChat demonstrating cell type interactions by each tissue state. Black dashed circles identify pDCs. B) Ratio of interaction strengths between HC and CLE for different cell types. C) Heatmap of cell type interactions with the top 15 pathways included. D) Chord diagram of CCL and CXCL pathways annotated by the top 3 “sender” and “receiving” cell types. E) Heatmap of ligands identified by ligand-receptor analysis separated by cell type among the top 3 “sender” cell types. F) Heatmap of MNP populations from CLE tissues showing expression of upregulated ligand receptors by different cell types. G) UMAP plots highlighting cells with detectable IFNG and TNF expression; donut plots show the percentage of cell types. H) Heatmap of CD4 T effector memory and central memory populations with expression of Th1 and Th17 markers, separated by tissue state. I) Bubble plot of MNP populations from CLE tissues with expression of pattern recognition receptors, inflammatory markers, and activation markers. Color indicates relative expression levels between cell types in CLE and the size indicates the percentage of cells per cluster expressing the particular gene.
Figure 3:
Figure 3:. Inflammatory CLE environment reprograms the fibroblast lineage.
A) UMAP plot of detailed fibroblast subclustering. B) Stacked bar plot of percentage breakdown of tissue state in different fibroblast groups. C) UMAP plots of GREM1 and PLA2G2A expression separated by cell state. D) Diffusion maps of cells labeled by cluster identify, tissue state, pseudotime, as well as ISG15, GREM1, and PLA2G2A expression. E) Cell clusters rank ordered by median pseudotime. F) Bar plot of chemokines upregulated in labeled clusters, **** P < .0001, Wilcoxon Rank Sum test. G) Reactome pathway analysis showing upregulated pathways in PLA2G2A+ and GREM1+ fibroblasts. H) BITFAM analysis of fibroblast clusters showing different patterns of transcription factor activity. I) UMAP plots of inferred transcription factor.
Figure 4:
Figure 4:. Spatial sequencing suggests pathogenic importance of type I interferon-dependent GREM1 Fibroblasts.
A) Pre- and post-treatment photos (8 week interval after Anifrolumab) of patient with subacute cutaneous lupus showing near complete resolution in disease activity. B) UMAP clustering of 10x Visium spatial sequencing of skin biopsy tissues from pre-treatment active disease (CLE_pre), post-treatment (CLE_post), and healthy control (ctrl) tissues. C) Unique clusters present only in CLE active disease sample. D) Spatial plots of gene expression for the labeled genes or gene signatures for a particular cell type (pDC, T cell). E) In situ hybridization of GREM1 (green) and CXCL10 (magenta) in CLE skin. E labels pre-treatment epidermis and D for dermis, with the dotted line indicating the demarcation. Magnification 200X, scale bar = 100 μM. F) Pre- and post Anifrolumab (12 week) site-matched biopsy displaying the dermal-epidermal junction of discoid lupus stained with GREM1. Magnification 200X, scale bar = 100 μM G) Co-localization score for localizing cell type specific signatures in spatial sequencing data. Upper panel shows myeloid signatures from our single cell dataset (labels on right) and lower shows lymphoid signatures. Quantified using Multimodal intersection analysis (see methods). * indicates statistically significant enrichment (P < 0.05) and color intensity maps to elevated odds ratios. The patient in this image consented to its use in the publication.
Figure 5:
Figure 5:. Deregulated expression of transposable elements correlates with interferon signature in CLE.
A) Heatmap of scTE analysis of skin dataset reveals elevated retroelement expression across multiple cell types in NL and CLE skin. B) Volcano plot of Endothelial and Fibroblast clusters (CLE vs HC). Donut plots show distribution of statistically significant upregulated retroelements (adjusted P < 0.05). C) Histogram of cell counts (y axis) and expression levels (x axis) of selected genes. D) Correlation matrix showing statistically significant correlations (P < .0001) between ISG expression and retroelements among labeled cell types. Non-significant correlations remain blank. E) Heatmap of RLR and cGAS-STING pathway gene expression among different cell types and tissue states in CLE. F) Violin plot demonstrating decrease in L2b retroelement levels after treatment with CLE treatment Anifrolumab, comparable to healthy control levels. These are fibroblast clusters identified in Figure 4B. G) Heatmap of RLR and cGAS-STING pathway gene expression pre and post-Anifrolumab in CLE.

References

    1. Stull C, Sprow G, Werth VP. Cutaneous Involvement in Systemic Lupus Erythematosus: A Review for the Rheumatologist. J Rheumatol. 2023. Jan;50(1):27–35. - PMC - PubMed
    1. Chang AY. Response to Antimalarial Agents in Cutaneous Lupus Erythematosus: A Prospective Analysis. Arch Dermatol. 2011. Nov 1;147(11):1261. - PMC - PubMed
    1. Achtman JC, Werth VP. Pathophysiology of cutaneous lupus erythematosus. Arthritis Res Ther. 2015. Dec;17(1):182. - PMC - PubMed
    1. Hile GA, Kahlenberg JM. Immunopathogenesis of skin injury in systemic lupus erythematosus. 2020; Available from:www.co-rheumatology.com - PMC - PubMed
    1. Fetter T, Braegelmann C, De Vos L, Wenzel J. Current Concepts on Pathogenic Mechanisms and Histopathology in Cutaneous Lupus Erythematosus. Front Med. 2022. May 30;9:915828. - PMC - PubMed

LinkOut - more resources