

Alternative Mutational Architectures Producing Identical M-Matrices can Lead to Different Patterns of Evolutionary Divergence
- PMID: 40410123
- PMCID: PMC12147023
- DOI: 10.1093/gbe/evaf099
Alternative Mutational Architectures Producing Identical M-Matrices can Lead to Different Patterns of Evolutionary Divergence
Abstract
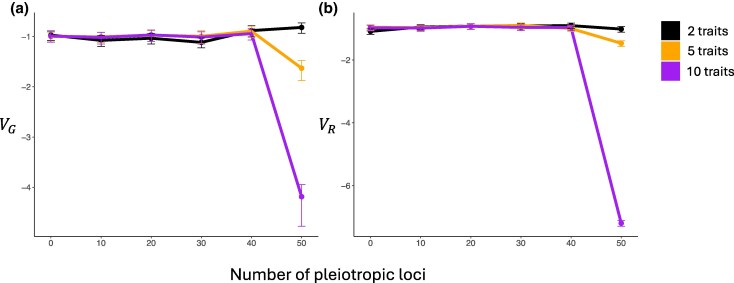
Explaining macroevolutionary divergence in light of population genetics requires understanding the extent to which the patterns of mutational input contribute to long-term trends. In the context of quantitative traits, mutational input is typically described by the mutational variance-covariance matrix, the M-matrix, which summarizes phenotypic variances and covariances introduced by new mutations per generation. However, as a summary statistic, the M-matrix does not fully capture all the relevant information from the underlying mutational architecture, and there exist a myriad of possible underlying mutational architectures that give rise to the same M-matrix. Using individual-based simulations, we demonstrate mutational architectures that produce the same M-matrix can lead to different levels of constraint on evolution and result in difference in within-population genetic variance, between-population divergence, and rate of adaptation. In particular, the rate of adaptation and that of neutral evolution are both reduced when a greater proportion of loci are pleiotropic. Our results reveal that aspects of mutational input not reflected by the M-matrix can have a profound impact on long-term evolution and suggest it is important to take them into account in order to connect patterns of long-term phenotypic evolution to underlying microevolutionary mechanisms.
Keywords: M-matrix; adaptation; phenotypic evolution; pleiotropy.
© The Author(s) 2025. Published by Oxford University Press on behalf of Society for Molecular Biology and Evolution.
Figures


Update of
-
Alternative mutational architectures producing identical -matrices can lead to different patterns of evolutionary divergence.bioRxiv [Preprint]. 2024 Dec 5:2023.08.11.553044. doi: 10.1101/2023.08.11.553044. bioRxiv. 2024. Update in: Genome Biol Evol. 2025 May 30;17(6):evaf099. doi: 10.1093/gbe/evaf099. PMID: 39677663 Free PMC article. Updated. Preprint.
Similar articles
-
Alternative mutational architectures producing identical -matrices can lead to different patterns of evolutionary divergence.bioRxiv [Preprint]. 2024 Dec 5:2023.08.11.553044. doi: 10.1101/2023.08.11.553044. bioRxiv. 2024. Update in: Genome Biol Evol. 2025 May 30;17(6):evaf099. doi: 10.1093/gbe/evaf099. PMID: 39677663 Free PMC article. Updated. Preprint.
-
The mutation matrix and the evolution of evolvability.Evolution. 2007 Apr;61(4):727-45. doi: 10.1111/j.1558-5646.2007.00071.x. Evolution. 2007. PMID: 17439608
-
Variation in mutational (co)variances.G3 (Bethesda). 2023 Feb 9;13(2):jkac335. doi: 10.1093/g3journal/jkac335. G3 (Bethesda). 2023. PMID: 36548954 Free PMC article.
-
Studying phenotypic evolution using multivariate quantitative genetics.Mol Ecol. 2006 Apr;15(4):883-96. doi: 10.1111/j.1365-294X.2006.02809.x. Mol Ecol. 2006. PMID: 16599954 Review.
-
Climbing mount probable: mutation as a cause of nonrandomness in evolution.J Hered. 2009 Sep-Oct;100(5):637-47. doi: 10.1093/jhered/esp048. Epub 2009 Jul 22. J Hered. 2009. PMID: 19625453 Review.
References
-
- Adams DC. Evaluating modularity in morphometric data: challenges with the RV coefficient and a new test measure. Methods Ecol Evol. 2016:7(5):565–572. 10.1111/mee3.2016.7.issue-5. - DOI
MeSH terms
Grants and funding
LinkOut - more resources
Full Text Sources
