. 2025 May 23;16(1):4818.
doi: 10.1038/s41467-025-59886-w.

p53-inducible lncRNA LOC644656 causes genotoxic stress-induced stem cell maldifferentiation and cancer chemoresistance

Affiliations

p53-inducible lncRNA LOC644656 causes genotoxic stress-induced stem cell maldifferentiation and cancer chemoresistance

Ai Tamura et al. Nat Commun. .

Abstract

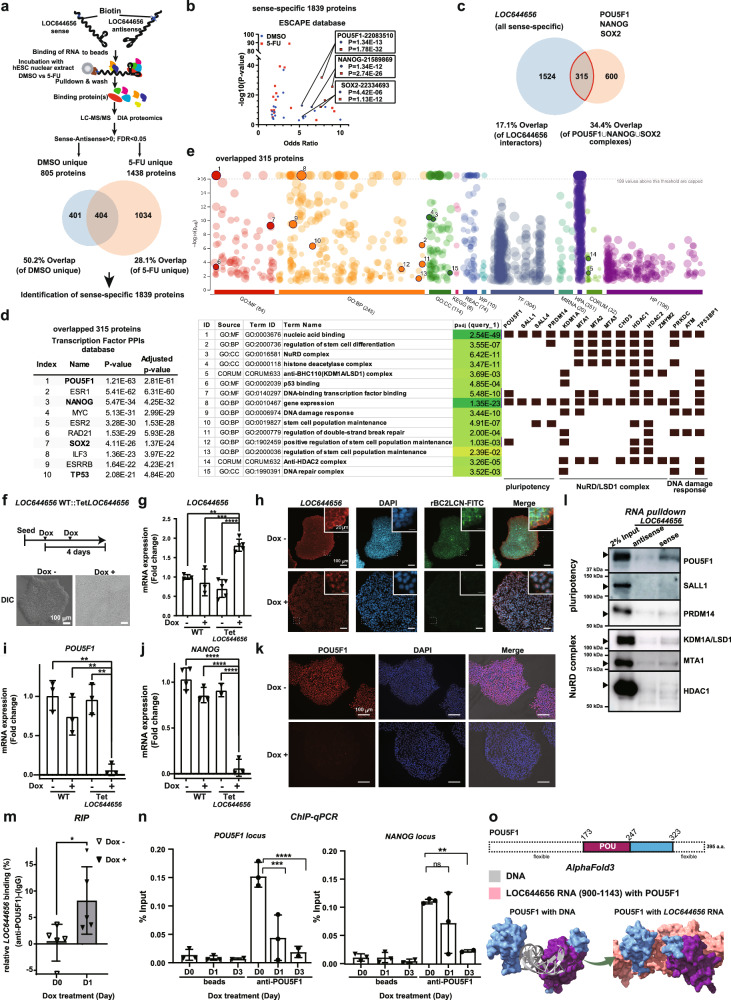
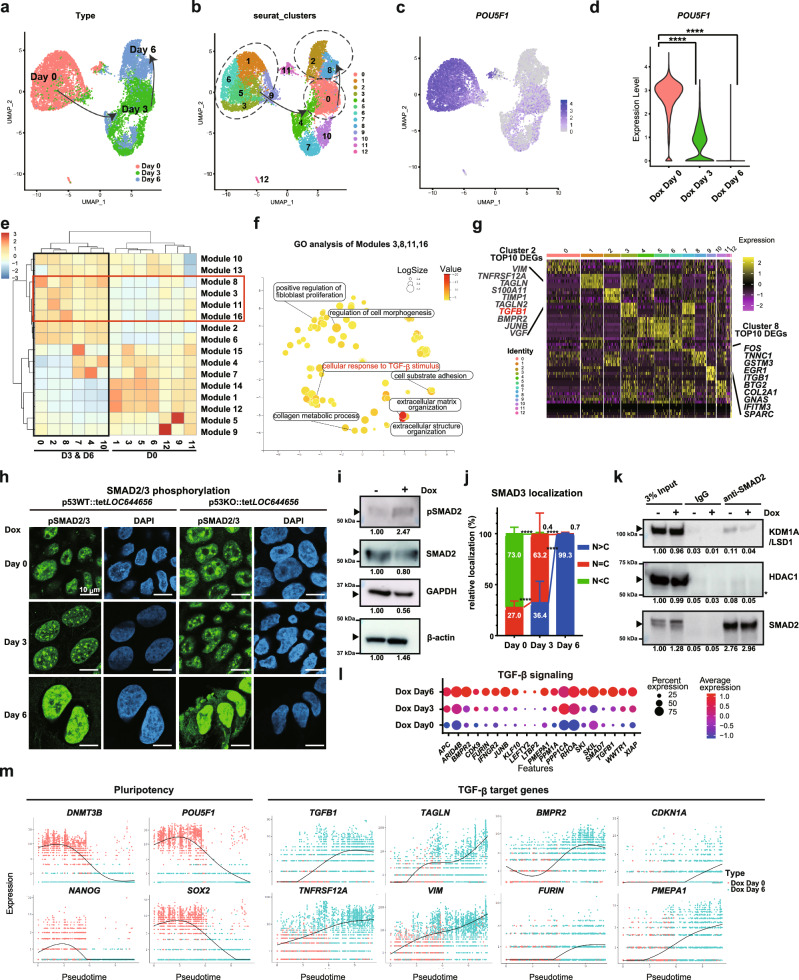
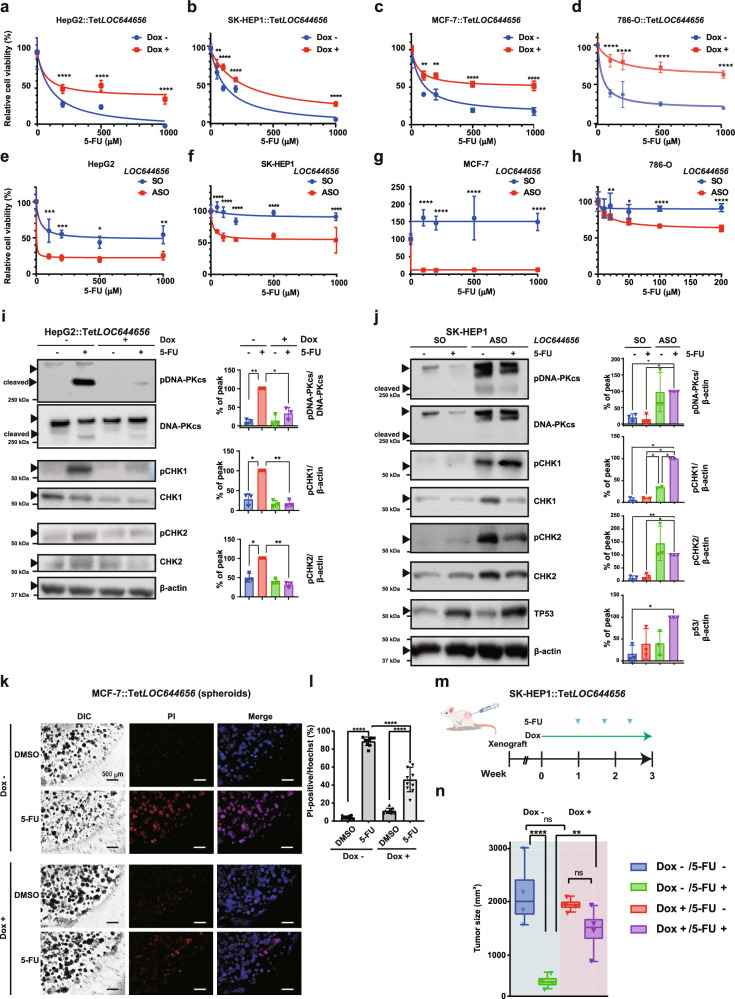
Genotoxic stress-induced stem cell maldifferentiation (GSMD) integrates DNA damage responses with loss of stemness and lineage-specific differentiation to prevent damaged stem cell propagation. However, molecular mechanisms governing GSMD remain unclear. Here, we identify the p53-induced long non-coding RNA LOC644656 as a key regulator of GSMD in human embryonic stem cells. LOC644656 accumulates in the nucleus upon DNA damage, disrupting pluripotency by interacting directly with POU5F1 and KDM1A/LSD1-NuRD complexes, repressing stemness genes, and activating TGF-β signaling. Additionally, LOC644656 mitigates DNA damage by binding DNA-PKcs and modulating the DNA damage response. In cancer, elevated LOC644656 correlates with poor patient survival and enhanced chemoresistance. Our findings demonstrate that LOC644656 mediates stemness suppression and resistance to genotoxic stress by coordinating DNA damage signaling and differentiation pathways. Thus, LOC644656 represents a potential therapeutic target for overcoming chemoresistance and advancing stem cell biology.


Conflict of interest statement

Competing interests: The authors declare no competing interests.

Figures

Fig. 1
Fig. 1. Genotoxic stress-induced stem cell maldifferentiation (GSMD) occurs in hESCs via TGF-β signaling.
a Schematic of the workflow. b Stemness in hESCs was evaluated using FITC-conjugated rBC2LCN in the presence or absence of 5-FU for 24 h. Images are representative of n = 3 independent experiments with similar results. c Heatmap displaying the expression of representative mRNAs involved in pluripotency (n = 3 biologically independent samples). d Radar charts depicting the expression of typical triploblastic genes in hESCs after 5-FU treatment. Data are presented as mean ± SEM from n = 3 biologically independent samples. (No statistical test was performed.). e Genes differentially expressed in a p53-dependent manner from RNA-seq (n = 3 biologically independent experiments). f p53-dependent upregulated genes (327) overlapping with cell development-related genes (GO:0048468). The 327 and 2140 genes identified in VENNY 2.1 were subjected to GO analysis (panels g, h). g GO analysis of the 327 upregulated developmental genes using BioPlanet 2019. Statistical significance was determined by two-sided Fisher’s exact test with Benjamini–Hochberg (BH) correction; exact p-values are shown. h GO analysis of the 327 upregulated developmental genes using ARCHS4 Tissues. Statistical significance was determined by two-sided Fisher’s exact test with BH correction; exact p-values are shown. i TGF-β signaling was evaluated by immunostaining for SMAD3 and FITC–rBC2LCN under 5-FU, ADR, or DNR. Images are representative of n = 4 independent experiments with similar results. Scale bars, 50 μm.
Fig. 2
Fig. 2. p53-induced LOC644656 is required for genotoxic stress-mediated suppression of pluripotency in hESCs.
a Venn diagram of 268 differentially expressed (DE) lncRNAs identified from RNA-seq and p53 ChIP-seq analyses (DDR vs DMSO > 5-fold). b Integrative Genomics Viewer tracks for p53 ChIP-seq, ATAC-seq, and RNA-seq at the LOC644656 locus. The pink asterisk indicates the α-p53 ChIP-seq track in p53KO hESCs. c, d Immunoblot analyses of p53 after treatment with Nutlin-3a (c) or 5-FU (d). Molecular weight markers (kDa) are shown on the left. Blots are representative of n = 3 independent experiments with similar results; uncropped blots are provided in the Source Data file. The samples derive from the same experiment but different gels for p53 and β-actin in parallel. eh Real-time RT-PCR analysis of p21/CDKN1A (e, g) and LOC644656 (f, h) relative to ACTB under Nutlin-3a or 5-FU treatment. Data are presented as mean ± SEM from n = 3 biologically independent samples. *p < 0.05, **p < 0.01, ***p < 0.001 (two-sided one-way ANOVA with Dunnett’s post hoc test). i, RNA-FISH of LOC644656 in hESCs ± 5-FU. Yellow arrows indicate nuclear speckles. Images are representative of n = 3 independent experiments with similar results. Scale bars: 100 μm (main images), 20 μm (insets). j Subcellular fractionation of LOC644656 in cytoplasmic (Cyt), nuclear (Nuc), and chromatin (Chr) fractions. XIST is used as a nuclear control. *Data are mean ± SEM (n = 3), p < 0.05 by two-sided Student’s t-test vs untreated. k Schematic of CRISPR/Cas9-based LOC644656 knockout (KO). l LOC644656 expression in WT vs KO hESCs. **Data are mean ± SEM (n = 4), **p < 0.0001 by two-sided Student’s t-test. m NANOG expression ± 5-FU in WT vs KO hESCs. **Data are mean ± SEM (n = 3); two-way ANOVA (two-sided) with Tukey’s post hoc test, **p < 0.01, *p < 0.001 vs untreated WT. n FITC-rBC2LCN staining of pluripotency ± 5-FU for 12 h. Images are representative of n = 3 independent experiments with similar results. Scale bar, 100 μm. Exact p-values and 95% confidence intervals: Fig. 2e: p = 0.017, 95% CI [16.10, 114.3] (0 μM vs 30 μM p53WT); p < 0.0001, 95% CI [86.74, 185.0] (0 μM vs 50 μM p53WT); Fig. 2f: p < 0.0001, 95% CI [−6.118, −2.894] (0 μM vs 30 μM p53WT); p < 0.0001, 95% CI [−12.29, −9.061] (0 μM vs 50 μM p53WT); Fig. 2g: p = 0.0391, 95% CI [−71.64, −4.455] (0 μM vs 300 μM p53WT); p = 0.0055, 95% CI [−82.77, −12.59] (0 μM vs 1000 μM p53WT); Fig. 2h: p < 0.0001, 95% CI [−3.369, −1.235] (0 μM vs 100 μM p53WT); p < 0.0001, 95% CI [−3.852, −1.719] (0 μM vs 300 μM p53WT); p < 0.0001, 95% CI [−4.994, −2.860] (0 μM vs 1000 μM p53WT); Fig. 2j: p = 0.0341, 95% CI [2.451, 24.09]; Fig. 2l: p = 0.001, 95% CI [−1.091, −0.8315]; Fig. 2m: p = 0.0052, 95% CI [−0.8581, −0.1572] (LOC644656 WT vs KO, 8 h); p = 0.001, 95% CI [−0.9778, −0.2769] (LOC644656 WT vs KO, 24 h).
Fig. 3
Fig. 3. LOC644656 interacts with the POU5F1 complex to attenuate pluripotency in hESCs.
a Schematic of the RNA pulldown assay. b ESCAPE database analysis of the 1,839 LOC644656-interacting proteins (±5-FU). Key pluripotency transcription factors are highlighted. c Overlap between LOC644656 interactors and the POU5F1/NANOG/SOX2 complex. d Transcription factor protein–protein interaction network of the 315 overlapping proteins. e Functional categories and GO terms enriched among the identified interactors. f Experimental workflow for hESC::TetLOC644656 induction. g LOC644656 expression ± doxycycline (Dox). Data are mean ± SEM (n = 3), **p < 0.01, ***p < 0.001, ****p < 0.0001 by two-sided one-way ANOVA. h RNA-FISH of LOC644656 (green) and FITC–rBC2LCN (red) ± Dox for four days. Images are representative of n = 3 independent experiments with similar results. Scale bars: 100 μm (main images), 20 μm (insets). i, j RT–PCR analysis of POU5F1(i) and NANOG (j) ± Dox. Data means SEM (n = 3), **p < 0.01 by two-sided one-way ANOVA. k Immunofluorescence for POU5F1 ± Dox for three days. Representative of n = 3 independent experiments. Scale bar, 50 μm. l RNA pulldown assay using biotinylated sense or antisense LOC644656. Representative of n = 3 independent experiments. Uncropped blots are provided in Source Data. The samples derive from the same experiment but different gels for POU5F1, NANOG, another for LSD1 and another for HDAC1 were processed in parallel. m RIP assay with an anti-POU5F1 antibody in hESC::TetLOC644656 ± Dox. Data means SEM (n = 3), *p < 0.05 by two-sided paired t-test. n ChIP assay of POU5F1 binding at target loci ± Dox. Data means SEM (n = 3), *p < 0.05, **p < 0.01, ***p < 0.001, ****p < 0.0001 by two-sided one-way ANOVA. o AlphaFold3 structural modeling of POU5F1 bound to DNA (left) or LOC644656 RNA (right). Exact p-values and 95% confidence intervals: Panel g: p = 0.001, 95% CI [−1.282, −0.3534] (WT Dox - vs WT::TetLOC644656 Dox +); p = 0.0003, 95% CI[−1.423, −0.4947] (WT Dox + vs WT::TetLOC644656 Dox +); p < 0.0001, 95% CI [−1.517, −0.7135] (WT::TetLOC644656 Dox - vs WT::TetLOC644656 Dox +). Panel i: p = 0.0011, 95% CI [0.4657, 1.430] (WT Dox - vs WT::TetLOC644656 Dox +); p = 0.0082, 95% CI[0.2014, 1.166] (WT Dox + vs WT::TetLOC644656 Dox +); p = 0.0015, 95% CI [0.4160, 1.381] (WT::TetLOC644656 Dox - vs WT::TetLOC644656 Dox +). Panel j: p < 0.0001, 95% CI [0.7270, 1.213] (WT Dox - vs WT::TetLOC644656 Dox +); p < 0.0001, 95% CI[0.5330, 1.052] (WT Dox + vs WT::TetLOC644656 Dox +); p < 0.0001, 95% CI [0.5568, 1.138] (WT::TetLOC644656 Dox - vs WT::TetLOC644656 Dox +). Panel m: p = 0.0368, 95% CI [0.7986, 15.18] (Day 0 vs Day 1, Dox +). Panel n: POU5F1 locus: p = 0.0002, 95% CI [0.06560, 0.1564] (Day 0 vs Day 1, Dox +); p < 0.0001, 95% CI[0.08524, 0.1868] (Day 0 vs Day 3, Dox +); NANOG locus: p = 0.0057, 95% CI [0.02939, 0.1483] (Day 0 vs Day 3, Dox +).
Fig. 4
Fig. 4. LOC644656 induction suppresses stemness and activates TGF-β signaling in hESCs at the single-cell level.
ad hESC::TetLOC644656 cells were cultured ± Dox for 0, 3, or 6 days and analyzed by scRNA-seq (n = 12,707 cells, one library). a UMAP plot showing cell distribution colored by time point (Day 0, Day 3, Day 6). b UMAP plot with cluster assignments (numbered 0-12). c UMAP visualization of POU5F1 expression across clusters. d Violin plot comparing POU5F1 expression levels between time points. Statistical analysis by two-sided Wilcoxon rank sum test. e Heatmap showing module-cluster relationships with modules 3, 8, 11, and 16 notably upregulated at Days 3 and 6. f Gene Ontology analysis (REVIGO) of genes in modules 3, 8, 11, and 16. g Heatmap of differentially expressed genes by cluster. h Representative immunostaining images of phospho-SMAD2/3 ± Dox at Day 3 or Day 6. Images are from n = 3 independent experiments with similar results. Scale bar, 50 μm. i Immunoblot analysis of SMAD2 phosphorylation ± Dox for 6 days. Representative of n = 3 independent experiments. Samples derive from the same experiment and were processed on the same gel. Uncropped blots are provided in the Source Data file. j Quantification of SMAD3 localization (n > C: nuclear>cytoplasmic; n = C: nuclear=cytoplasmic; n < C: nuclear<cytoplasmic). Data are mean ± SEM (n = 3). Statistical analysis by two-sided one-way ANOVA with Tukey’s post hoc test. k Co-immunoprecipitation of SMAD2/LSD1/HDAC1 complex in nuclei ± LOC644656 induction. Representative of n = 3 independent experiments. Samples derive from the same experiment but SMAD2, LSD1, and HDAC1 were analyzed on separate gels in parallel. Uncropped blots are provided in the Source Data file. l Dot plot showing TGF-β target gene expression across clusters and treatment conditions. Dot size indicates percentage of expressing cells; color intensity shows average expression level. Statistical analysis by two-sided Wilcoxon rank sum test. m Pseudotime trajectory analysis (Monocle 3) showing progressive loss of pluripotency and gain of TGF-β signaling. Exact p-values and 95% confidence intervals: Panel d POU5F1: p < 0.0001 (Day 3 vs Day 0 and Day 6 vs Day 0). Panel j SMAD3 localization: n > C pattern: Day 0 vs Day 3: p < 0.0001, 95% CI [−46.02, −18.81]; Day 0 vs Day 6: p < 0.0001, 95% CI [−112.9, −85.67]; Day 3 vs Day 6: p < 0.0001, 95% CI [−79.03, −54.69]. n = C pattern: Day 0 vs Day 3: p < 0.0001, 95% CI [−52.83, −25.62]; Day 0 vs Day 6: p < 0.0001, 95% CI [13.45, 40.66]; Day 3 vs Day 6: p < 0.0001, 95% CI [54.11, 78.45]. n < C pattern: Day 0 vs Day 3: p < 0.0001, 95% CI [58.04, 85.25]; Day 0 vs Day 6: p < 0.0001, 95% CI [58.62, 85.83]. Panel l: Complete statistical analysis with exact p-values is provided in the Source Data file.
Fig. 5
Fig. 5. LOC644656 induction prevents genotoxic stress-induced apoptosis in hESCs.
a, b hESC::TetLOC644656 cells ( ± Dox for 5 days) were treated with DMSO or 5-FU for 24 h, then subjected to scRNA-seq (n = 9,891 cells, one library). a UMAP plot colored by treatment condition. b UMAP with cluster assignments (numbered 0-10). c Hierarchical clustering of gene modules versus cell clusters. Red box indicates modules enriched in clusters 6 & 8; blue box highlights module 10. d, e Gene Ontology analysis (REVIGO) of module 10 (d) and modules 9 & 11 (e). f AlphaFold3 structural model showing DNA-PKcs interaction with LOC644656. g RNA pulldown assay demonstrating DNA-PKcs binding to sense LOC644656. Representative of n = 3 independent experiments. Uncropped blots are provided in the Source Data file. h In vitro kinase assay measuring DNA-PKcs autophosphorylation ± LOC644656. Data are mean ± SEM (n = 3), *p < 0.05, **p < 0.01 by two-sided repeated measures ANOVA. Each experiment was separately analyzed with phospho-DNA-PKcs and DNA-PKcs antibodies. Uncropped blots are provided in the Source Data file. i Immunoblot analysis of DNA damage response (DDR) proteins in hESC::TetLOC644656 cells ± Dox for 2 days, then 5-FU for 24 h. Data are mean ± SEM (n = 3), *p < 0.05, **p < 0.01 by two-sided one-way ANOVA. The samples derive from the same experiment but different gels for each antibody were processed in parallel. Uncropped blots are provided in the Source Data file. j Immunoblot analysis in LOC644656 WT vs KO hESCs after 5-FU treatment for 6 h Data are mean ± SEM (n = 3), *p < 0.05, **p < 0.01 by two-sided two-way ANOVA. The samples derive from the same experiment but different gels for each antibody were processed in parallel. Uncropped blots are provided in the Source Data file. k Dot plot showing expression of major p53 target genes from scRNA-seq analysis. Dot size represents percentage of expressing cells; color intensity shows average expression level. l Real-time RT-PCR analysis of PUMA/BBC3 expression ± Dox, ± 5-FU. Data are mean ± SEM (n = 3), **p < 0.01, ***p < 0.001 by two-sided two-way ANOVA. Complete source data are provided in the Source Data file. m, n Flow cytometric analysis of apoptosis using Annexin V staining in hESC::TetLOC644656 cells ± Dox for 24 h, followed by ADR treatment for 24 h. Data are mean ± SEM (n = 3), ****p < 0.0001 by two-sided one-way ANOVA with Tukey’s post hoc test. Exact p-values and 95% confidence intervals: Panel h (kinase assay): lane 1 vs lane 2: p = 0.0034, 95% CI [−1.054, −0.2608]; lane 2 vs lane 3: p = 0.0083, 95% CI [−0.9610, −0.1683]; lane 2 vs lane 4: p = 0.0099, 95% CI [−0.9436, −0.1509]; lane 2 vs lane 5: p = 0.0019, 95% CI [−1.115, −0.3218]. Panel i (key protein ratios): pDNA-PKcs/DNA-PKcs: lane 1 vs lane 2: p = 0.0082, 95% CI [−1.091, −0.3419]; lane 2 vs lane 4: p = 0.0067, 95% CI [0.3992, 1.163]. pATM/ATM: lane 1 vs lane 2: p = 0.0216, 95% CI [−1.404, −0.2994]; lane 2 vs lane 4: p = 0.0086, 95% CI [0.4656, 1.092]. pATR/ATR: lane 1 vs lane 2: p = 0.0043, 95% CI [−0.9063, −0.3710]; lane 2 vs lane 4: p = 0.0191, 95% CI [0.2063, 1.184]. pCHK1/β-actin: lane 1 vs lane 2: p = 0.0145, 95% CI [−1.238, −0.2731]; lane 2 vs lane 4: p = 0.0005, 95% CI [0.7428, 1.107]. pCHK2/β-actin: lane 1 vs lane 2: p = 0.0145, 95% CI [−0.9435, −0.1945]; lane 2 vs lane 4: p = 0.0384, 95% CI [0.08776, 1.285]. p53/β-actin: lane 1 vs lane 2: p = 0.0044, 95% CI [−1.200, −0.6516]; lane 2 vs lane 4: p = 0.0096, 95% CI [0.4764, 1.182]. Panel j (WT vs KO): pDNA-PKcs/DNA-PKcs: lane 1 vs lane 2: p = 0.0363, 95% CI [−1.557, −0.1296]; lane 2 vs lane 4: p = 0.0452, 95% CI [−1.915, −0.05092]. pCHK1/CHK1: lane 1 vs lane 2: p = 0.0271, 95% CI [0.1147, 1.360]; lane 2 vs lane 4: p = 0.0065, 95% CI [−1.661, −0.4154]. p53/β-actin: lane 1 vs lane 2: p = 0.0011, 95% CI [−1.036, −0.7781]. Panel l (RT-PCR): DMSO vs 5-FU, WT: p = 0.0031, 95% CI [−322.2, −65.49]; DMSO vs 5-FU, WT::TetLOC644656: p = 0.0001, 95% CI [−405.8, −149.2]. Panel n (Annexin V): DMSO vs ADR, WT: p < 0.0001, 95% CI [−89.22, −48.58]; DMSO vs ADR, WT::TetLOC644656: p < 0.0001, 95% CI [−83.65, −43.01]; WT ADR vs WT::TetLOC644656 Dox + ADR: p < 0.0001, 95% CI [54.57, 92.58]; Dox – ADR vs Dox + ADR, WT::TetLOC644656: p < 0.0001, 95% CI [46.70, 84.72].
Fig. 6
Fig. 6. LOC644656 is highly expressed in tumors and primarily correlates with poor prognosis.
a Kaplan–Meier survival analysis comparing high versus low LOC644656 expression across multiple TCGA tumor types (n = 80–500 patients per tumor type). Hazard ratios (HRs) and log-rank p-values are shown. Red asterisks indicate reference HR values in smaller cohorts. b, c Kaplan–Meier survival plots for liver hepatocellular carcinoma (LIHC, b) and kidney renal clear cell carcinoma (KIRC, c). HRs and p-values determined by two-sided log-rank tests using Kaplan–Meier Plotter. d Identification of 7650 common genes correlated with LOC644656 expression across 22 tumor types. The Venn diagram highlights 147 genes that overlap with the 647 GSMD-related genes identified in Fig. 1f. e, f Gene Ontology analysis of the 147 overlapping genes using CellMarker Augmented 2021 (e) and DisGeNET (f). Statistical significance determined by two-sided Fisher’s exact test with Benjamini-Hochberg correction. g Correlation matrix showing tumor/normal fold change relationships among the 147 genes. Red boxes indicate gene clusters associated with specific tumor types. h Pearson correlation analysis of LOC644656 and POU5F1 expression in LIHC tumor samples from TCGA database. i, j Real-time RT-PCR analysis of LOC644656, POU5F1, and NANOG expression in SK-HEP1::TetLOC644656 cells ± Dox (i), or SK-HEP1 cells transfected with sense oligonucleotides (SO) or antisense oligonucleotides (ASO) (j). Data are mean ± SEM (n = 3). Statistical analysis by two-sided Student’s t-test. k, l Expression analysis of TGFB1 and its downstream targets in SK-HEP1::TetLOC644656 cells ± Dox (k) or SK-HEP1 cells ± LOC644656-ASO (l). Data are mean ± SEM (n = 3). Statistical analysis by two-sided Student’s t-test. m, n Effect of TGFBR1 inhibitor (SB431542) treatment on SK-HEP1::TetLOC644656 cells ± Dox for 72 h. Expression of pluripotency markers (m) and TGF-β pathway genes (n) were analyzed by RT-PCR. Data are mean ± SEM (n = 3). Statistical analysis by two-sided one-way ANOVA with Tukey’s post hoc test. Exact p-values and 95% confidence intervals: Panel a (survival analysis): BLCA: p = 0.00084; HNSC: p = 0.043; KIRC: p = 2.6e-09; LIHC: p = 0.037; LUAD: p = 0.035; PAAD: p = 3e-04; PCPG: p = 3.1e-05; READ: p = 0.0024; STAD: p = 0.043; THYM: p = 0.00052. Panel h: LIHC Tumor: p = 3.82e-08. Panel i: LOC644656: p = 0.0064, 95% CI [0.7682, 2.512] (Dox – vs Dox +). POU5F1: p = 0.0087, 95% CI [0.2493, 1.334] (Dox – vs Dox +). NANOG: p = 0.0354, 95% CI [0.06535, 1.666] (Dox – vs Dox +). Panel j: LOC644656: p = 0.0005, 95% CI [−0.3779, −0.1488] (SO vs ASO). POU5F1: p = 0.0015, 95% CI [−0.6490, −0.2510] (SO vs ASO). NANOG: p = 0.0359, 95% CI [−1.520, −0.08622] (SO vs ASO). Panel k: TGFB1: p = 0.0031, 95% CI [0.7513, 3.024] (Dox – vs Dox +). TAGLN: p < 0.0001, 95% CI [2.058, 2.689] (Dox – vs Dox +). TWIST1: p < 0.0001, 95% CI [0.7678, 1.605] (Dox – vs Dox +). SNAI1: p < 0.0001, 95% CI [7.195, 11.01] (Dox – vs Dox +). ZEB1: p = 0.0012, 95% CI [0.6746, 1.372] (Dox – vs Dox +). CDH1: p = 0.002, 95% CI [3.474, 11.17] (Dox – vs Dox +). VEGFA: p = 0.0286, 95% CI [0.07875, 0.8412] (Dox – vs Dox +). Panel l: TGFB1: p = 0.0262, 95% CI [−0.6054, −0.05461] (SO vs ASO). TAGLN: p = 0.0071, 95% CI [−0.3183, −0.06505] (SO vs ASO). SNAI1: p = 0.0261, 95% CI [−0.6258, −0.06748] (SO vs ASO). VEGFA: p = 0.0449, 95% CI [−0.7579, −0.01206] (SO vs ASO). Panel m: POU5F1: p < 0.0001, 95% CI [−1.202, −0.7496] (Dox – vs Dox +). p < 0.0001, 95% CI [0.9179, 1.390] (Dox + vs Dox +/SB431542 +). NANOG: p < 0.0001, 95% CI [−2.433, −0.6762] (Dox – vs Dox +). Panel n: TGFB1: p < 0.0001, 95% CI [−2.877, −1.853] (Dox – vs Dox +). p < 0.0001, 95% CI [1.108, 2.132] (Dox + vs Dox +/SB431542 +). p = 0.0002, 95% CI [−1.475, −0.4514] (SB431542 + vs Dox +/SB431542 +). TAGLN: p < 0.0001, 95% CI [−1.373, −0.4674] (Dox – vs Dox +). p < 0.0001, 95% CI [0.6591, 1.564] (Dox + vs Dox +/SB431542 +). p = 0.0302, 95% CI [−0.9443, −0.03908] (SB431542 + vs Dox +/SB431542 +). TWIST1: p < 0.0001, 95% CI [−3.209, −1.434] (Dox – vs Dox +). p = 0.0007, 95% CI [0.6062, 2.381] (Dox + vs Dox +/SB431542 +). p = 0.0152, 95% CI [−1.952, −0.1778] (SB431542 + vs Dox +/SB431542 +). SNAI1: p < 0.0001, 95% CI [−46.84, −25.98] (Dox – vs Dox +). p < 0.0001, 95% CI [16.00, 36.86] (Dox + vs Dox +/SB431542 +). ZEB1: p < 0.0001, 95% CI [−2.140, −1.370] (Dox – vs Dox +). p < 0.0001, 95% CI [0.4885, 1.258] (Dox + vs Dox +/SB431542 +). p < 0.0001, 95% CI [−1.235, −0.4652] (SB431542 + vs Dox +/SB431542 +).
Fig. 7
Fig. 7. LOC644656 expression prevents genotoxic stress-induced death of cancer cells.
ad Cell viability (CCK-8) assays for HepG2::TetLOC644656 (a), SK-HEP1::TetLOC644656 (b), MCF-7::TetLOC644656 (c), and 786-O::TetLOC644656 (d) cells ± Dox for 1 day, followed by 5-FU treatment for 24–72 h. Data are mean ± SEM (n = 3). Statistical analysis by two-sided two-way ANOVA with Tukey’s post hoc test. eh Dose-response curves for HepG2 (e), SK-HEP1 (f), MCF-7 (g), and 786-O (h) cells transfected with LOC644656 sense oligonucleotides (SO) or antisense oligonucleotides (ASO) for 48 h, then treated with 5-FU for 24 h. Data are mean ± SEM (n = 3). Statistical analysis by two-sided two-way ANOVA with Tukey’s post hoc test. i, Immunoblot analysis of DNA damage response proteins in HepG2::TetLOC644656 cells ± Dox, then 5-FU. Data are mean ± SEM (n = 3). Statistical analysis by two-sided one-way ANOVA with Tukey’s post hoc test. The samples derive from the same experiment but different gels for each antibody were processed in parallel. Uncropped blots are provided in the Source Data file. j Immunoblot analysis of genotoxic stress-sensing proteins in SK-HEP1 cells transfected with SO or ASO for 48 h, then 5-FU for 12 h. Data are mean ± SEM (n = 3). Statistical analysis by two-sided one-way ANOVA with Tukey’s post hoc test. The samples derive from the same experiment but different gels for each antibody were processed in parallel. Uncropped blots are provided in the Source Data file. k, l 3D spheroid assay of MCF-7::TetLOC644656 cells ± Dox for 24 h, then 5-FU for 24 h. Spheroids were stained with propidium iodide (PI)/Hoechst. Data are mean ± SEM (n = 3). Statistical analysis by two-sided one-way ANOVA with Tukey’s post hoc test. m Schematic of the mouse xenograft experimental design. Cells were randomly allocated into four groups, and transplantation was independently performed by two investigators to minimize allocation bias. n Tumor size measurements in each treatment group. Data are mean ± SEM (n = 3). Statistical analysis by two-sided one-way ANOVA with Tukey’s post hoc test. Exact p-values and 95% confidence intervals: Panels ad (viability assays): Panel a (HepG2): 0 vs 200 μM: p < 0.0001, 95% CI [−31.34, −11.03]; 0 vs 500 μM: p < 0.0001, 95% CI [−39.94, −19.62]; 0 vs 1000 μM: p < 0.0001, 95% CI [−47.23, −26.91]. Panel b (SK-HEP1): 0 vs 50 μM: p = 0.0039, 95% CI [−15.63, −2.230]; 0 vs 100 μM: p < 0.0001, 95% CI [−34.60, −21.20]; 0 vs 200 μM: p < 0.0001, 95% CI [−19.27, −5.406]; 0 vs 1000 μM: p < 0.0001, 95% CI [−27.68, −13.35]. Panel c (MCF-7): 0 vs 100 μM: p = 0.0014, 95% CI [−28.93, −5.778]; 0 vs 200 μM: p = 0.0012, 95% CI [−29.14, −5.985]; 0 vs 500 μM: p < 0.0001, 95% CI [−42.49, −19.34]; 0 vs 1000 μM: p < 0.0001, 95% CI [−42.34, −19.19]. Panel d (786-O): 0 vs 100 μM: p < 0.0001, 95% CI [−53.90, −29.02]; 0 vs 200 μM: p < 0.0001, 95% CI [−54.24, −29.36]; 0 vs 500 μM: p < 0.0001, 95% CI [−59.06, −34.18]; 0 vs 1000 μM: p < 0.0001, 95% CI [−55.18, −30.30]. Panels eh (ASO effects): Panel e (HepG2): 0 vs 100 μM: p = 0.0002, 95% CI [15.13, 55.41]; 0 vs 200 μM: p = 0.0005, 95% CI [12.64, 52.92]; 0 vs 500 μM: p = 0.0149, 95% CI [3.588, 43.87]; 0 vs 1000 μM: p = 0.0023, 95% CI [8.777, 49.06]. Panel f (SK-HEP1): 0 vs 50 μM: p < 0.0001, 95% CI [22.42, 54.76]; 0 vs 100 μM: p < 0.0001, 95% CI [23.37, 55.72]; 0 vs 200 μM: p < 0.0001, 95% CI [13.00, 45.35]; 0 vs 500 μM: p < 0.0001, 95% CI [20.24, 52.38]; 0 vs 1000 μM: p < 0.0001, 95% CI [21.00, 53.34]. Panel g (MCF-7): 0 vs 100 μM: p < 0.0001, 95% CI [102.6, 195.7]; 0 vs 200 μM: p < 0.0001, 95% CI [88.06, 181.1]; 0 vs 500 μM: p < 0.0001, 95% CI [101.2, 194.3]; 0 vs 1000 μM: p < 0.0001, 95% CI [89.61, 182.7]. Panel h (786-O): 0 vs 20 μM: p = 0.0038, 95% CI [3.730, 27.16]; 0 vs 50 μM: p = 0.0132, 95% CI [2.018, 25.45]; 0 vs 100 μM: p < 0.0001, 95% CI [12.09, 35.52]; 0 vs 200 μM: p < 0.0001, 95% CI [16.17, 41.21]. Panel i (protein ratios): pDNA-PKcs/DNA-PKcs: lane 1 vs lane 2: p = 0.0033, 95% CI [−1.124, −0.6438]; lane 2 vs lane 4: p = 0.0446, 95% CI [0.03890, 1.297]. pCHK1/β-actin: lane 1 vs lane 2: p = 0.032, 95% CI [−1.288, −0.1482]; lane 2 vs lane 4: p = 0.0092, 95% CI [0.4796, 1.159]. pCHK2/β-actin: lane 1 vs lane 2: p = 0.0419, 95% CI [−0.9614, −0.04393]; lane 2 vs lane 4: p = 0.0087, 95% CI [0.4070, 0.9570]. Panel j (ASO effects on signaling): pDNA-PKcs/β-actin: lane 1 vs lane 4: p = 0.0166, 95% CI [−1.256, −0.3476]; lane 2 vs lane 4: p = 0.0264, 95% CI [−1.466, −0.2393]. pCHK1/β-actin: lane 1 vs lane 4: p = 0.0407, 95% CI [−1.771, −0.1221]; lane 2 vs lane 3: p = 0.0423, 95% CI [−0.4667, −0.02649]; lane 2 vs lane 4: p = 0.0211, 95% CI [−0.9051, −0.8952]; lane 3 vs lane 4: p = 0.0211, 95% CI [−0.8687, −0.4384]. pCHK2/β-actin: lane 1 vs lane 4: p = 0.0082, 95% CI [−1.233, −0.5412]; lane 2 vs lane 4: p = 0.0139, 95% CI [−1.282, −0.4078]. p53/β-actin: lane 1 vs lane 4: p = 0.044, 95% CI [−1.620, −0.05384]. Panel l (3D spheroid): DMSO Dox - vs 5-FU Dox -: p < 0.0001, 95% CI [−92.97, −75.85]; 5-FU Dox - vs 5-FU Dox +: p < 0.0001, 95% CI [33.64, 51.16]; DMSO Dox + vs 5-FU Dox +: p < 0.0001, 95% CI [−43.36, −25.84]. Panel n (xenograft): Dox - /5-FU - vs Dox -/5-FU +: p < 0.0001, 95% CI [1024, 2292]; Dox - /5-FU + vs Dox +/5-FU +: p = 0.0017, 95% CI [−1601, −332.8].

Similar articles

References

    1. Mandal, P. K. & Rossi, D. J. DNA-damage-induced differentiation in hematopoietic stem cells. Cell148, 847–848 (2012). - PubMed
    1. Santos, M. A. et al. DNA-damage-induced differentiation of leukaemic cells as an anti-cancer barrier. Nature514, 107–111 (2014). - PMC - PubMed
    1. Schneider, L. et al. DNA damage in mammalian neural stem cells leads to astrocytic differentiation mediated by BMP2 signaling through JAK-STAT. Stem Cell Rep.1, 123–138 (2013). - PMC - PubMed
    1. Wang, J. et al. A differentiation checkpoint limits hematopoietic stem cell self-renewal in response to DNA damage. Cell148, 1001–1014 (2012). - PubMed
    1. Vousden, K. H. & Prives, C. Blinded by the Light: The growing complexity of p53. Cell137, 413–431 (2009). - PubMed

MeSH terms