. 2025 May 23;16(1):4644.
doi: 10.1038/s41467-025-59566-9.

Association of distinct microbial and metabolic signatures with microscopic colitis

Affiliations

Association of distinct microbial and metabolic signatures with microscopic colitis

Albert Sheng-Yin Chen et al. Nat Commun. .

Abstract

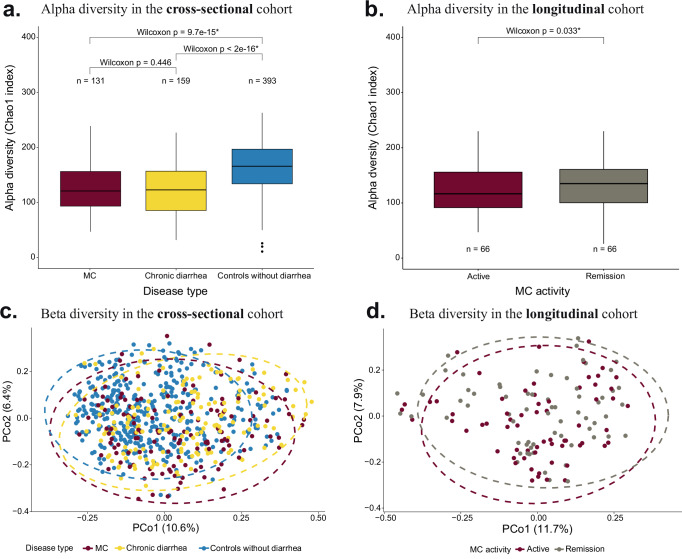
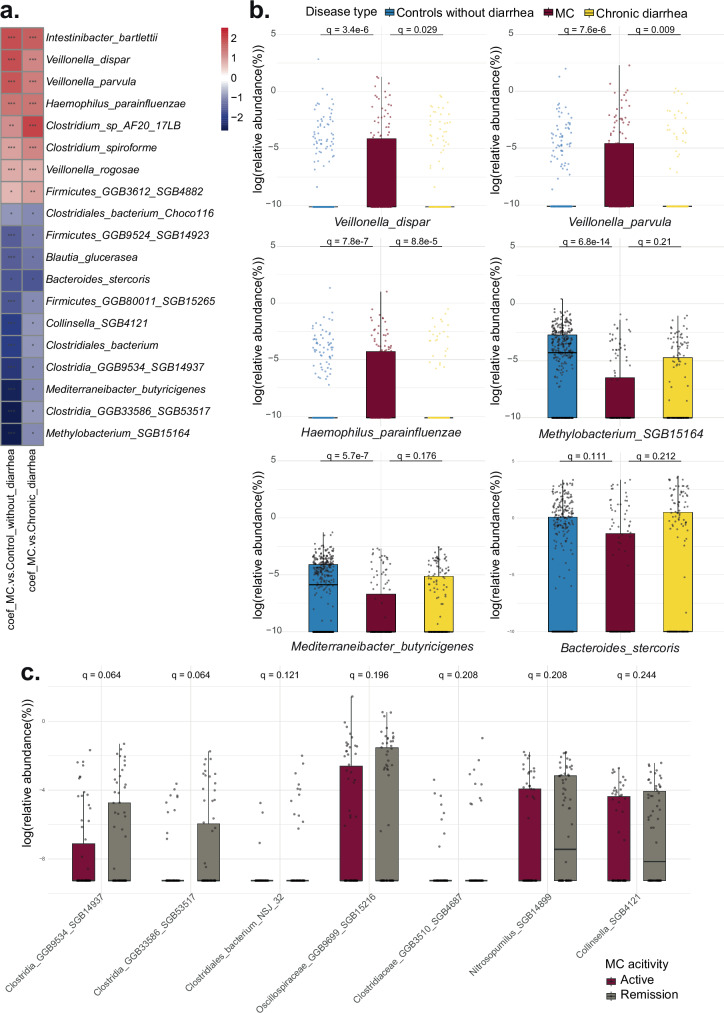
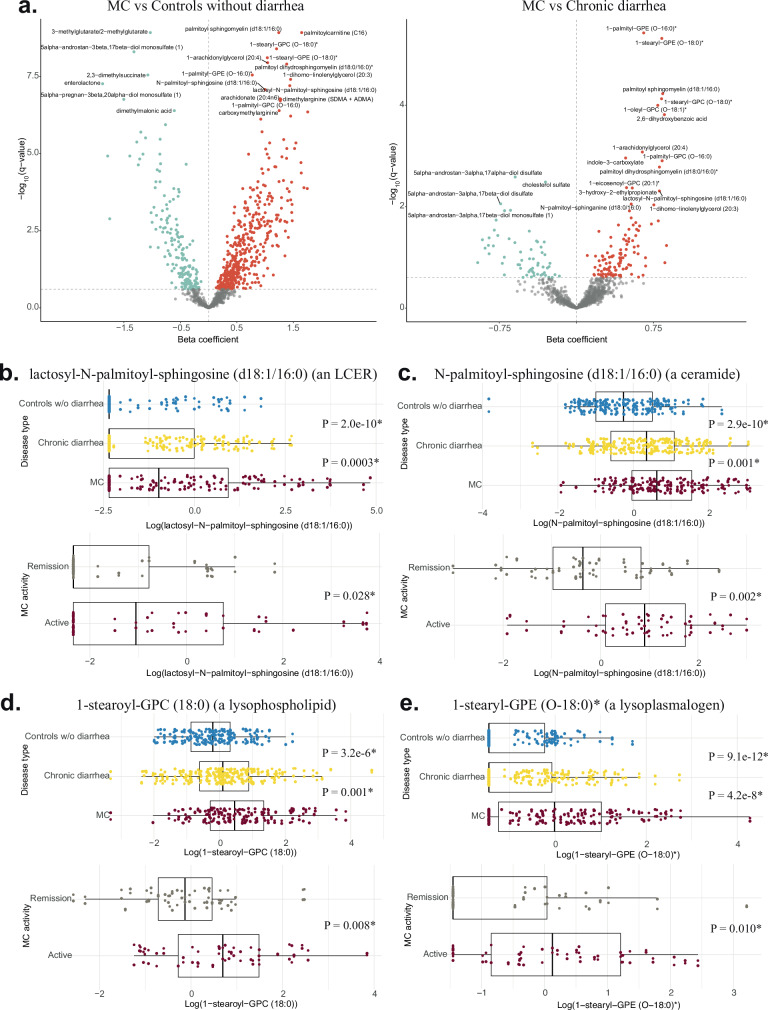
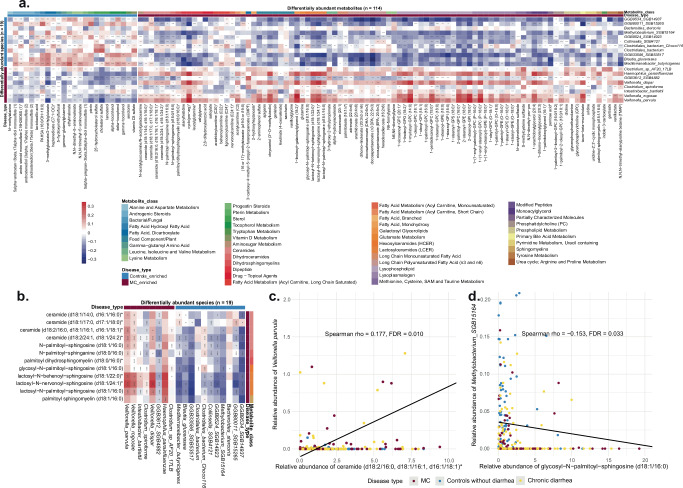
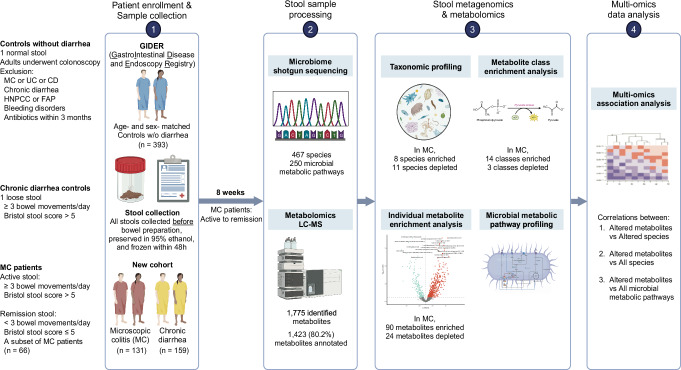
Microscopic colitis (MC) is a chronic inflammatory disease of the large intestine that primarily affects older adults and presents with chronic diarrhea. The etiology is unknown and there are currently no FDA approved medications or biomarkers for treatment or monitoring of the disease. Emerging evidence have implicated the gut microbiome and metabolome disturbances in MC pathogenesis. We conduct a comprehensive analysis of gut microbial and metabolic changes in a cohort of 683 participants, including 131 patients with active MC, 159 with chronic diarrhea, and 393 age- and sex-matched controls without diarrhea. Stool microbiome and metabolome are profiled using whole-genome shotgun metagenomic sequencing and ultra-high performance liquid chromatography-mass spectrometry, respectively. Compared to controls, eight microbial species including pro-inflammatory oral-typical Veillonella dispar and Haemophilus parainfluenzae, and 11 species, including anti-inflammatory Blautia glucerasea and Bacteroides stercoris are enriched and depleted in MC, respectively. Pro-inflammatory metabolites, including lactosylceramides, ceramides, lysophospholipids, and lysoplasmalogens, are enriched in active MC. Multi-omics analyses reveal robust associations between microbial species, metabolic pathways, and metabolites, suggesting concordant disruptions in MC. Here, we show distinct shifts in gut microbiome and metabolome in MC that can inform the development of non-invasive biomarkers and novel therapeutics.


Conflict of interest statement

Competing interests: H.Kh. has served on clinical advisory board for Cylinder and has received consulting fees from Aditium Bio for work unrelated to the topic. K.S. has served as a consultant to Ardelyx, Gemelli Biotech, Laborie, Mahana, Salix, and Takeda and has received research support from Ardelyx and ReStalsis for work unrelated to the topic. Other authors have no competing interests to disclose. Ethical approval: The study was approved by Partners Human Research Committee and the Institutional Review Board of Mass General Brigham (Protocol # 2015P001333 and # 2015P000275).

Figures

Fig. 1
Fig. 1. Differences between microbial composition of MC and comparator groups.
a, b Alpha diversity (Chao 1 index) in the cross-sectional (a) and longitudinal cohorts (b). Cross-sectionally, the alpha diversity in the MC microbiome is lower than that of controls without diarrhea but not chronic diarrhea group. Longitudinally, the alpha diversity is higher in the remission phase compared to active phase among patients with MC. Data are shown as median with interquartile range (IQR, 25th and 75th). Whiskers indicated 1.5*IQR. P-values are two-sided without multiple testing adjustment. Source data are provided as a Source Data file. c, d Principal coordinate analysis (PCoA) based on Bray–Curtis dissimilarity show no significant differences in microbial composition comparing MC to chronic diarrhea or controls without diarrhea (c) and active MC versus MC in remission (d). Source data are provided as a Source Data file.
Fig. 2
Fig. 2. Comparisons of relative abundance of altered species according to disease type and activity.
a The heatmap shows the β coefficient of species with altered abundance comparing MC to both controls in the cross-sectional cohort. We use the following model to adjust for confounding factors: Log (Microbiome features) ~ intercept + Disease type (MC vs Chronic diarrhea vs Controls without diarrhea) + BSS (> 5 vs ≤ 5)+age+sex + BMI. Source data are provided as a Source Data file. *** FDR q < 0.05; ** 0.05 ≤ FDR q < 0.1; * 0.1 ≤ FDR p < 0.25. b Examples of log-transformed abundances of altered species in MC group (n = 131) in the cross-sectional cohort (Controls without diarrhea: n = 393, Chronic diarrhea: n = 159). V. dispar, V. parvula, and H. parainfluenzae are enriched in MC, while Methylobacterium_SGB15164, M. butyricigenes, and B. stercoris are depleted. Data are shown as median with interquartile range (IQR, 25th and 75th). Whiskers indicated 1.5*IQR. Source data are provided as a Source Data file. c Examples of log-transformed abundances of altered species in active MC (n = 66) versus MC in remission (n = 66) in the longitudinal cohort. All species are depleted in active MC compared to remission. Benjamini–Hochberg FDR q-values are derived from Wilcoxon signed rank tests. Data are shown as median with interquartile range (IQR, 25th and 75th). Whiskers indicated 1.5*IQR. Source data are provided as a Source Data file.
Fig. 3
Fig. 3. Comparisons of relative abundance of altered metabolite classes according to disease type and activity.
a The box plots show 14 enriched metabolite classes (median t-statistics > 0) and three depleted metabolite classes (median t-statistics < 0) in MC compared to both controls after multi-variable adjustment. The dotted lines illustrated the significance threshold of an individual metabolite. T-statistics are derived from MaAsLin using the model: Log (Metabolite features)intercept + Disease type (MC vs Chronic diarrhea vs Controls without diarrhea) + BSS (> 5 vs ≤ 5)+age+sex + BMI. Data are shown as median with interquartile range (IQR, 25th and 75th). Whiskers indicated 1.5*IQR. Source data are provided as a Source Data file. be Enrichment analyses of metabolite class in the cross-sectional (top) (MC: n = 131, Controls without diarrhea: n = 393, Chronic diarrhea: n = 159) and longitudinal (n = 66) cohorts (bottom). We use the following model to adjust for confounding factors in the longitudinal cohort: Log (Metabolite features) ~ intercept + BSS (> 5 vs ≤ 5)+age+sex + BMI. Data are shown as median with interquartile range (IQR, 25th and 75th). Whiskers indicated 1.5*IQR. P-values are derived from the logistic regression and are two-sided without multiple testing adjustment. Source data are provided as a Source Data file.
Fig. 4
Fig. 4. Comparisons of relative abundance of altered individual metabolites according to disease type and MC activity.
a The volcano plots demonstrate alteration of individual metabolites’ relative abundance in MC compared to both controls. Red color indicates enriched relative abundance, turquoise color indicates depleted relative abundance, and gray color indicates no change in relative abundance. Coefficients and q-values are derived from MaAsLin using the same model. Source data are provided as a Source Data file. be Enrichment analyses of candidate individual metabolites in the cross-sectional (top) (MC: n = 131, Controls without diarrhea: n = 393, Chronic diarrhea: n = 159) and longitudinal (n = 66) cohorts (bottom). We use the following model to adjust for confounding factors in the longitudinal cohort: Log (Metabolite features) ~ intercept + BSS ( > 5 vs ≤ 5)+age+sex + BMI. Data are shown as median with interquartile range (IQR, 25th and 75th). Whiskers indicated 1.5*IQR. P-values are derived from the logistic regression and are two-sided without multiple testing adjustment. Source data are provided as a Source Data file.
Fig. 5
Fig. 5. Correlations between differentially abundant species and metabolites grouped by disease type.
a Metabolites and species are classified and clustered as MC-enriched (brown) or control-enriched (blue, including controls without diarrhea and chronic diarrhea). Metabolites are further grouped by metabolite class. The abundance of metabolites and microbes covariate concordantly with a clear pattern that MC-enriched species and metabolites (or control-enriched species and metabolites) are positively correlated, while MC-enriched species and control-enriched metabolites (or control-enriched species and MC-enriched metabolites) are negatively correlated. Source data are provided as a Source Data file. *** FDR q < 0.05; ** 0.05 ≤ FDR q < 0.1; * 0.1 ≤ FDR p < 0.25. b Correlations between sphingolipids (MC-enriched metabolite) and species. Source data are provided as a Source Data file. c, d Examples of individual correlations between MC-enriched sphingolipids and V. parvula (MC-enriched) or Methylobacterium SGB15164 (control-enriched). Concordantly, positive correlations are observed between MC-enriched species and MC-enriched sphingolipids, while negative correlations are found between control-enriched species and MC-enriched sphingolipids. Source data are provided as a Source Data file.
Fig. 6
Fig. 6. Overall study design.
Created in BioRender. Chen, A. (2025) https://BioRender.com/v34u718.

Update of

Similar articles

References

    1. Nyhlin, N., Wickbom, A., Montgomery, S. M., Tysk, C. & Bohr, J. Long-term prognosis of clinical symptoms and health-related quality of life in microscopic colitis: a case–control study. Aliment. Pharmacol. Ther.39, 963–972 (2014). - PubMed
    1. Burke, K. E. et al. Microscopic colitis. Nat. Rev. Dis. Prim.7, 39 (2021). - PubMed
    1. Daferera, N. et al. Fecal stream diversion and mucosal cytokine levels in collagenous colitis: a case report. World J. Gastroenterol.21, 6065–6071 (2015). - PMC - PubMed
    1. Rindom Krogsgaard, L., Kristian Munck, L., Bytzer, P. & Wildt, S. An altered composition of the microbiome in microscopic colitis is driven towards the composition in healthy controls by treatment with budesonide. Scand. J. Gastroenterol.54, 446–452 (2019). - PubMed
    1. Morgan, D. M. et al. Microscopic colitis is characterized by intestinal dysbiosis. Clin. Gastroenterol. Hepatol.18, 984–986 (2020). - PubMed

MeSH terms

LinkOut - more resources