. 2025 May 23;16(1):4793.
doi: 10.1038/s41467-025-59874-0.

Oral ENPP1 inhibitor designed using generative AI as next generation STING modulator for solid tumors

Affiliations

Oral ENPP1 inhibitor designed using generative AI as next generation STING modulator for solid tumors

Congying Pu et al. Nat Commun. .

Abstract

Despite the STING-type-I interferon pathway playing a key role in effective anti-tumor immunity, the therapeutic benefit of direct STING agonists appears limited. In this study, we use several artificial intelligence techniques and patient-based multi-omics data to show that Ectonucleotide Pyrophosphatase/Phosphodiesterase 1 (ENPP1), which hydrolyzes STING-activating cyclic GMP-AMP (cGAMP), is a safer and more effective STING-modulating target than direct STING agonism in multiple solid tumors. We then leverage our generative chemistry artificial intelligence-based drug design platform to facilitate the design of ISM5939, an orally bioavailable ENPP1-selective inhibitor capable of stabilizing extracellular cGAMP and activating bystander antigen-presenting cells without inducing either toxic inflammatory cytokine release or tumor-infiltrating T-cell death. In murine syngeneic models across cancer types, ISM5939 synergizes with targeting the PD-1/PD-L1 axis and chemotherapy in suppressing tumor growth with good tolerance. Our findings provide evidence supporting ENPP1 as an innate immune checkpoint across solid tumors and reports an AI design-aided ENPP1 inhibitor, ISM5939, as a cutting-edge STING modulator for cancer therapy, paving a path for immunotherapy advancements.


Conflict of interest statement

Competing interests: The Authors declare the following competing interests: All listed authors are affiliated with Insilico Medicine, a global clinical-stage commercial generative AI company with several hundred patents and patent applications and commercially available software. Insilico Medicine is a company developing an AI-based end-to-end integrated pipeline for drug discovery and development that is engaged in drug-discovery programs for aging, fibrosis and oncology. C.P., H.C., H.Y., X.C., M.Z., L.Q., Z.N., W.Z., S.C., L.W., X.L., D.G., F.W.P., F.R., and A.Z. are affiliated with Insilico Medicine or were affiliated with Insilico Medicine when the studies were performed. The remaining authors declare no competing interest. No other conflicts are reported.

Figures
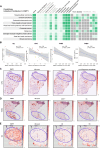
Fig. 1
Fig. 1. Validation of ENPP1 as an innate immune checkpoint in solid tumors and indication prioritization for ENPP1 targeting strategies.
A Indication prioritization tools embedded in PandaOmics to rank indications for ENPP1. B The correlation analysis of type-I IFN related immune parameters across cancer types: Correlation between ENPP1 expression in tumor cells and ISG score in conventional dendritic cells (cDC) in gastric cancer (OMIX001073, n = 10) and colorectal cancer (CRC, GSE132465, n = 23), as well as correlation between ENPP1 expression in tumor cells and CXCL10 expression in dendritic cells (DC) and cDC percentage in triple-negative breast cancer (TNBC, GSE176078, n = 10). Each dot represents a single patient sample. The x-axis indicates the ENPP1 expression in tumor cells and the y-axis displays the corresponding immune parameters: ISG score, CXCL10 expression or cDC percentage. The P value and correlation were performed using Pearson’s correlation coefficient, with the resulting trend line depicted in blue. The gray shaded area surrounding the trend line represents the 95% confidence intervals. Source data are provided as a Source Data file. C Spatial distribution of ENPP1, ISG score and predicted proportion of CD8 T and pro-inflammatory macrophage cells per spot in histology slide SN84_A120838_Rep2 from CRC patient (Zenodo record: 7760264). The color represents the value of ENPP1 expression, ISG score and predicted proportion of DC and NK cells per spot. Source data are provided as a Source Data file. D Spatial distribution of ENPP1, ISG score and predicted proportion of CD4 T and DC cells per spots in slide GSM6433591_094A from a TNBC patient (GEO: GSE210616). The color represents the value of ENPP1 expression, ISG score and predicted proportion of DC and NK cells per spot. Source data are provided as a Source Data file. E Spatial distribution of ENPP1, ISG score and predicted proportion of DC and NK cells per spot in slide 21_00734_LI_SING from a GC patient (GEO: GSE251950). The color represents the value of ENPP1 expression, ISG score and predicted proportion of DC and NK cells per spot. Source data are provided as a Source Data file.
Fig. 2
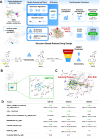
Fig. 2. Generative AI-aided discovery of an ENPP1 inhibitor.
A Flow scheme for AI-facilitated ENPP1 inhibitor discovery. ReRSA, retrosynthesis related synthetic accessibility; SA, synthetic accessibility; PXR, pregnane xenobiotic receptor. Novelty calculated based on the dataset compiled from ChEMBL. Alchemistry, accurately estimates the relative binding free energy to prioritize molecules with efficient physics-based methods. ADMET prediction, predict physicochemical and ADMET molecular properties. B Docking pose of ISM7516 with human ENPP1. The source data are provided as a Source Data file. ENPP1 (white) is shown in ribbon and ISM7516 (cyan) is drawn in sphere, while key residues (white) and ISM7516(cyan) are shown in stick. C Docking pose of ISM5939 with human ENPP1. The source data are provided as a Source Data file. ISM5939 (yellow) was superimposed with AMP (purple, PDB ID: 6wfj) and QPS2 (green, PDB ID: 6wev). Zn atoms are shown as gray sphere and dashed lines indicate hydrogen bonds or coordination bonds. D Biochemical/cellular activity, △Gcal, CYP3A4 induction, hERG inhibition and predicted hERG inhibition value of candidate inhibitors. The data are colored by profiling results. Green represents ideal profiling, orange indicates potential issues, black represents acceptable results, and red represents unacceptable outcomes. CYP3A4 induction calculated as ratio of CYP3A4 mRNA following compound treatment at 10 µM compared to rifampicin. △Gcal was calculated by Alchemistry tool. hERG, human ether-a-go-go-related gene. Predicted hERG inhibition values were achieved by ADMET prediction module.
Fig. 3
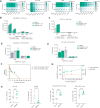
Fig. 3. ISM5939 inhibits ENPP1-mediated cGAMP and ATP degradation with high potency and selectivity.
A Concentration response curves of ISM5939 or positive control (ENPP-1-IN-1) in ENPP1 enzymatic assay (pH 7.4, n = 2 biological replicates, 2 independent experiments). Left, 2,3- cGAMP as substrate; right, ATP as substrate. B IC50 values for ISM5939 against human ENPP1 catalytic activity using 2’,3’ cGAMP or ATP as substrates at pH 7.4 and pH 6.5. C Concentration response curves of ISM5939 in the ENPP1 enzymatic assay at different concentrations of ATP and cGAMP (n = 2 biological replicates). DF The inhibitory activity of ISM5939 against the catalytic activity of (D) human ENPP2 (E) human ENPP3 and (F) table summary for IC50 values (n = 2 biological replicates). G The Rador map illustrating the effect of ISM5939 (10 μM) on SafetyOne44 Panel targets (n = 2 biological replicates). H Inhibitory effects of ISM5939 on cGAMP degradation mediated by soluble ENPP1 in human plasma detected by ELISA. I Stabilization of cGAMP in vivo in murine plasma by ISM5939 (n = 3 biological replicates). Data were analyzed by two‐tailed, unpaired Student’s t‐test. P-value < 0.05 were shown. J Potency of ISM5939 in maintaining extracellular cGAMP levels when applied to cancer cells in vitro (n = 2 biological replicates). Data were represented as mean ± SEM. Source data are provided as a Source Data file.
Fig. 4
Fig. 4. ISM5939 protects tumor-secreted cGAMP and orchestrates non-cell autonomous STING activation in APCs.
A Dose-dependent accumulation of extracellular cGAMP by ISM5939. Cancer cell lines as indicated were treated with a gradient of ISM5939 concentrations followed by detection of supernatant cGAMP levels via ELISA (n = 2 biological replicates, two independent experiments). The color represents cGAMP concentrations. B, C Type I interferon (IFN) pathway activation in THP1-Dual cells co-cultured with (B) MDA-MB-231 (B) or (C) ZR-75-30 tumor cells transfected with dsDNA (n = 2 biological replicates, two independent experiments). D, E Type I IFN pathway activation in IRF3-deficient THP1-dual cells co-cultured with (D) MDA-MB-231 or (E) ZR-75-30 tumor cells transfected with dsDNA (n = 2 biological replicates, two independent experiments). F, G 4T1 syngeneic tumor-bearing mice treated with a single dose of ISM5939 (10 mg/kg, p.o.), and plasma and tumor samples assayed for (F) drug concentrations of ISM5939 and (G) cGAMP (orange) and IFNβ (green) in tumor tissues (n = 3 biological replicates). H Quantification of tumor infiltrating immune cells by flow cytometry in 4T1 syngeneic tumor bearing mice treated with ISM5939 (n = 6 biological replicates). Data were analyzed by two‐tailed Student’s t‐test. P-value < 0.05 were shown. All data were represented as mean ± SEM. Source data are provided as a Source Data file.
Fig. 5
Fig. 5. ISM5939 has a wider therapeutic index than direct STING agonists.
A Drug-induced cytokine release from human PBMCs treated with ISM5939 or ADU-S100 for 24 h, followed by cytokine detection in the supernatant using ELISA. B Cytokine concentrations in plasma obtained from mice administered with STING agonists (diABZI, MSA-2) or ISM5939 for 7 days via ELISA (n = 5 biological replicates). C Viability of T cells isolated from cultured human PBMCs treated with ISM5939 or STING agonists by flow cytometry (n = 2 biological replicates). The color represents cell numbers. DF Proportions and immunophenotypes of immune cells collected from plasma and tumor samples of MC38 tumor-bearing mice treated with STING agonists (orange) or ISM5939 (green) by flow cytometry 24 h after treatment (n = 6 biological replicates). D Live CD8 + T cells and CD4 + T cells within all live immune cells from blood. E Live total immune cells (left), CD8+ (middle) and CD4+ T cells (right) within all live immune cells in the tumor. F IFN-γ + (left) and TNF-α + (right) CD8 + T cells within all tumor-infiltrating CD8 + T cells. For B and DF, data were analyzed by two‐tailed Student’s t‐test. P-value < 0.05 were shown. Data were represented as mean ± SEM. Source data are provided as a Source Data file.
Fig. 6
Fig. 6. ISM5939 augments antitumor immunity and synergizes with anti-PD(L)1 immunotherapy.
A Baseline ENPP1 expression levels in Paclitaxel+anti-PD1 responsive or non-responsive breast cancer patients (GEO: GSE194040). n = 38 for responders and n = 31 for non-responders. B Baseline ENPP1 expression levels in anti-PD-L1 responsive or non-responsive esophageal adenocarcinoma patients with high LRRC8A expression. Data were extracted from GSE165252. n = 6 for responders and n = 3 for non-responders. For boxplots, boxes indicate 25th and 75th percentiles, the lines within boxes mark medians, whiskers extend over 1.5 times the interquartile range (IQR, the distance from 25th to 75th percentile); dots represent patient samples. C Combinational effect of ISM5939 and anti-PD-L1 therapy. MC38 tumor‐bearing C57BL/6 J mice were treated with anti‐PD‐L1 antibody (3 mg kg−1, twice per week) alone or in combination with ISM5939 (30 mg/kg, twice a day) for indicated days (n = 6 biological replicates per group). D Combinational effect of ISM5939 and anti-PD1 therapy. MC38 tumor‐bearing C57BL/6 J mice were treated with anti‐PD1 antibody (5 mg kg−1, twice per week) alone or in combination with ISM5939 at the indicated doses (n = 8 biological replicates per group). EH Tumor infiltrating immune cells analyzed by flow cytometry. MC38 tumor‐bearing C57BL/6 J mice were treated with anti‐PD1 antibody (5 mg kg−1, twice per week) alone or in combination with ISM5939 (20 mg kg−1, twice a day) for 7 consecutive days (n = 6 biological replicates). E, F The proportion of the indicated immune cells in tumor infiltrating CD45+ cells; G The ratio of CD8+ T cells (left) and CD4+ T cells (right) to Tregs. H CD69 positive ratios among the indicated immune subsets. I Tumor growth of CT26 syngeneic tumors. Tumor bearing mice (n = 6 biological replicates per group) were treated with anti-PD1 antibody alone or in combination with ISM5939 (20 mg kg−1, twice a day). Data are represented as mean ± SEM. For (A, B) and (EG), data were analyzed by two‐tailed Student’s t‐test. P value < 0.05 were shown. Data were represented as mean ± SEM. Source data are provided as a Source Data file.
Fig. 7
Fig. 7. The combination of ISM5939 with chemotherapy maximizes cGAMP release and synergistically inhibits tumor growth.
A Baseline ENPP1 expression levels in chemotherapy responsive or non-responsive TNBC, HER2 positive breast cancer, ER positive breast cancer and colorectal cancer patients. Data were extracted from GSE22513, GSE50948, GSE22093 and GSE28702. For TNBC, n = 8 for responders and n = 20 for non-responders; for HER2 positive breast cancer, n = 22 for responders and n = 71 for non-responders; for ER positive breast cancer, n = 10 for responders and n = 32 for non-responders; for CRC, n = 42 for responders and n = 41 for non-responders. For boxplots, boxes indicate 25th and 75th percentiles, the lines within boxes mark medians, whiskers extend over 1.5 times the interquartile range (IQR, the distance from 25th to 75th percentile); dots represent patient samples. B Maximal cGAMP release induced by combined use of cisplatin or paclitaxel with ISM5939 (n = 2 biological replicates, two independent experiments). CE EMT6 syngeneic tumor bearing mice treated with cisplatin and ISM5939 alone or in combination for 2 weeks to profile (C) differential tumor growth and (D, E) endpoint tumor sample bulk RNA sequencing showing (D) pathway enrichment (The color represents adjust P-value) and (E) deconvoluted immune cell populations in the tumor microenvironment post-treatment (n = 6 biological replicates for tumor growth detection, n = 3 biological replicates for RNA sequencing). Color represents z-scores of cell population, values range from red (low population) to green (high population). F Tumor growth of 4T1 orthotopic tumor-bearing mice treated with docetaxel and ISM5939 alone or in combination. G In vitro release of cGAMP by BRCA-proficient (MDA-MB-231, ID8) or BRCA-deficient (MDA-MB-436, UWB1.289) cells treated with Olaparib or ISM5939 alone or in combination via ELISA (n = 2 biological replicates). H Tumor growth of 4T1 orthotopic tumor-bearing mice treated with Olaparib and ISM5939 alone or in combination (n = 7 biological replicates). Data were represented as mean ± SEM. For (A), (C), (F) and (H), data were analyzed by two‐tailed Student’s t‐test. P value < 0.05 were shown. Source data are provided as a Source Data file.
Fig. 8
Fig. 8. Diagram illustrating the mechanism through which ISM5939 potentiates antitumor immune responses.
ISM5939 facilitates the accumulation of extracellular cGAMP by blocking ENPP1-dependent degradation, thereby triggering the cGAS-STING signaling pathway in antigen-presenting cells (APCs). This activation effectively enhances the activity of CD8 + T cells. Additionally, ISM5939 diminishes adenosine production by inhibiting ENPP1-mediated ATP hydrolysis, potentially mitigating the suppression of tumor-infiltrating T cells.

Similar articles

References

    1. Zhu, Y. et al. STING: a master regulator in the cancer-immunity cycle. Mol. Cancer18, 152 (2019). - PMC - PubMed
    1. Caiazza, C. et al. The Lack of STING Impairs the MHC-I Dependent Antigen Presentation and JAK/STAT Signaling in Murine Macrophages. Int. J. Mol. Sci.23, 14232 (2022). - PMC - PubMed
    1. McKee, A. S. et al. Host DNA released in response to aluminum adjuvant enhances MHC class II-mediated antigen presentation and prolongs CD4 T-cell interactions with dendritic cells. Proc. Natl. Acad. Sci.110, E1122–E1131 (2013). - PMC - PubMed
    1. Li, G. et al. cGAS-STING pathway mediates activation of dendritic cell sensing of immunogenic tumors. Cell. Mol. Life Sci.81, 149 (2024). - PMC - PubMed
    1. Cheng, H. et al. Activation of STING by cGAMP Regulates MDSCs to Suppress Tumor Metastasis via Reversing Epithelial-Mesenchymal Transition. Front. Oncol.10, 896 (2020). - PMC - PubMed

Substances