. 2025 May 23;16(1):4810.
doi: 10.1038/s41467-025-59945-2.

The health impacts and genetic architecture of food liking in cardio-metabolic diseases

Affiliations

The health impacts and genetic architecture of food liking in cardio-metabolic diseases

Wenbo Jiang et al. Nat Commun. .

Abstract

We evaluated temporal and genetic relationships between 176 food-liking-traits and cardio-metabolic diseases using data from the UK Biobank (N = 182,087) for observational analyses and summary-level GWAS data from FinnGen and other consortia (N = 406,565-977,323) for genetic analyses. Integrating observational and genetic results, we identified two detrimental food-liking-traits (bacon and diet-fizzy-drinks) and three protective food-liking-traits (broccoli, pizza, and lentils/beans). These food-liking-traits are associated with habitual food intake and influence cardio-metabolic proteins and biological processes. Notably, we found three genetic links: diet-fizzy-drinks with heart-failure, bacon with type-2-diabetes, and lentils/beans with type-2-diabetes, identifying 54 pleiotropic single-nucleotide-variants, impacting both phenotypes. Our data show the diet-fizzy-drinks and heart-failure link maybe not direct, as diet-fizzy-drinks liking correlates with sweet food consumption and shares variants linked to BMI, adiposity, platelet count and cardio-metabolic traits. The pleiotropic single-nucleotide-variants map to 251 tissue-specific genes, with four showing high druggability potential, highlighting personalized dietary strategies for cardio-metabolic diseases.


Conflict of interest statement

Competing interests: The authors declare no competing interests.

Figures
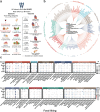
Fig. 1
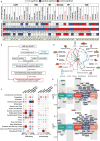
Fig. 1. Temporal relationships between FLTs and CMDs.
a Overview of the epidemiological design of the prospective cohort in the UK Biobank; Created in BioRender. https://BioRender.com/udq2dks; b Categories of 176 FLTs by ten major food categories; c Heatmap plot showing the association between FLTs and CMDs. Each circle represents the HRs estimating the association between FLTs and CMDs from Cox proportional hazards regression models, adjusted for age, sex, smoking status, drinking status, BMI, education level, income, TDI, MET, SBP, DBP, HDL-C, LDL-C, TC, and TG, with color indicating the direction of the association; The circle size reflects the effect size of FLTs on each CMD, and a two-sided P-FDR < 0.05 was considered statistically significant. FLTs food-liking traits, CMDs cardiometabolic diseases, HR hazards ratio, T2D type 2 diabetes, MI myocardial infarction, IHD ischemic heart disease, HF heart failure, CVDs cardiovascular diseases, BMI body mass index, TDI Townsend deprivation index, MET metabolic equivalent of task, SBP systolic blood pressure, DBP diastolic blood pressure, HDL-C high density lipoprotein cholesterol, LDL-C low density lipoprotein cholesterol, TC total cholesterol, TG triglycerides, P-FDR P-values with false discovery rates.
Fig. 2
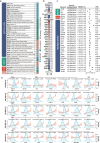
Fig. 2. Genetic associations between FLTs and CMDs.
a Overview of the design of the MR analysis; Created in BioRender. https://BioRender.com/r07vihs. b UVMR and MVMR for FLTs and CMDs. Left panel: Manhattan plot showing the P-FDR values in the UVMR for 10 categories of FLTs. The height of each point represents the negative logarithm of the P-FDR value for the IVW, with the color bar indicating different FLTs categories. The black dashed line indicates the P-FDR threshold (a two-sided P-FDR for UVMR-IVW < 0.05), and the specific FLTs showing significant differences after FDR correction are annotated with text labels. Right panel: Forest plots for the ORs and 95% CIs estimated by UV-IVW and MV-IVW, adjusted for household income, educational attainment, and physical activity levels. A two-sided P-FDR for UVMR-IVW and P-value for MVMR < 0.05 was considered statistically significant. Sample size [diseases (case/N)]: Total CVDs (221,781/231,952); IHD (75,592/378,141); MI (28,546/378,019); Stroke (67,162/454,450); HF (47,309/930,014); T2D (71,728/369,007). FLTs food-liking traits, CMDs cardiometabolic diseases, CVDs cardiovascular diseases, IHD ischemic heart disease, HF heart failure, MI myocardial infarction, T2D type 2 diabetes, LDSC linkage disequilibrium score regression, HDL high-definition likelihood, IVW inverse-variance weighted, UVMR univariate Mendelian randomization, MVMR multi-variable Mendelian randomization, OR odds ratio, 95% CI 95% confidence interval, MR Mendelian randomization.
Fig. 3
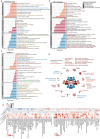
Fig. 3. Potential biological mechanisms underlying identified FLTs and CMDs.
a Selection process for FLTs and their corresponding diseases based on the consistency of temporal relationships and genetic associations. Four criteria were applied to screen for FLTs that were both temporally and genetically associated with CMDs: (1) The FLTs should be temporally associated with CMDs; (2) and (3) The FLTs should be genetically associated with CMDs, as indicated by UVMR and MVMR (adjusted for household income; educational attainment, and physical activity); (4) The genetic association between FLTs and CMDs should be unidirectional. b Overview of the analysis framework for potential biological mechanisms underlying the five identified FLTs and their corresponding CMDs. c Heatmap plot showing the correlation between the five identified FLTs and food intake, as indicated by PRS (N = 206,451) and questionnaire measurements (N = 124,352). Each cell represents Spearman correlation coefficients, and a two-sided P < 0.05 was considered statistically significant; d Radar chart depicting the dietary intake of the 17 food categories by the five identified FLTs (N = 124,352). Created in BioRender. https://BioRender.com/x3i0573. e Visualization of differential circulating cardiometabolic proteins between individuals with extremely liking and extremely disliking for specific foods (N = 6061 for bacon; N = 7419 for broccoli; N = 8432 for diet fizzy drinks; N = 4792 for lentils/beans; N = 3163 for pizza), and between the highest and lowest intake (N = 7370). Significantly up-regulated proteins are shown as red points, significantly down-regulated proteins are shown as green points, and non-significant proteins are shown as gray points. Overlapping proteins with the same direction of change are labeled with text annotations. A two-sided P-FDR < 0.05 was considered statistically significant. FLTs food-liking traits, CMDs cardiometabolic diseases, CVDs cardiovascular diseases, TDI Townsend deprivation index, MET metabolic equivalent of task, IHD ischemic heart disease, HF heart failure, MI myocardial infarction, T2D type 2 diabetes, UVMR univariate Mendelian randomization, MVMR multi-variable Mendelian randomization, PRS polygenic risk score, P-FDR P-values with false discovery rates.
Fig. 4
Fig. 4. Association between identified circulating plasma proteins and incidence of CMDs.
a Summary of the overlapping proteins. The arrows indicate the direction of change. b β coefficients estimated by linear regression models for the association between FLTs and circulating cardiometabolic proteins, adjusted for age, sex, BMI, TDI, and MET. c Forest plot showing the HRs and 95% CIs for the association between circulating proteins and corresponding diseases related to specific FLTs. HRs and 95% CIs were estimated by Cox proportional hazards regression models, adjusted for age, sex, race, smoking rate, education level, drinking rate, TDI, MET, BMI, SBP, DBP, HDL, LDL, TC, and TG. The dots and lines represent HRs and 95% CIs. The black dashed line indicates the P threshold (two-sided P < 0.05). d Restricted cubic spline for the association between circulating cardiometabolic proteins and their corresponding CMDs, adjusted for age, sex, race, smoking rate, education level, drinking rate, TDI, MET, BMI, SBP, DBP, HDL, LDL, TC, and TG. The P-value for the linear regression test was assessed by ANOVA, and a two-sided P < 0.05 was considered statistically significant. The lines represent HRs, and the shaded area around the red line represents the 95% CIs. FLTs food-liking traits, CMDs cardiometabolic diseases, CVDs cardiovascular diseases, IHD ischemic heart disease, HF heart failure, MI myocardial infarction, T2D type 2 diabetes, TDI Townsend deprivation index, MET metabolic equivalent of task, BMI body mass index, SBP systolic blood pressure, DBP diastolic blood pressure, HDL-C high density lipoprotein cholesterol, LDL-C low density lipoprotein cholesterol, TC total cholesterol, TG triglycerides, HRs hazards ratio.
Fig. 5
Fig. 5. Genetic correlation analysis and identification of shared genomic risk loci and genes in different FLT and CMDs pairs.
a Workflow for genetic correlation analysis and identification of pleiotropic genomic risk loci and genes for each FLT and CMD pair. b Genetic correlations between FLT and CMD pairs, as estimated using LDSC and HDL methods. A two-sided P-FDR < 0.05 was considered statistically significant. c Left panel: Manhattan plots of shared lead and INSIG SNVs in different FLT and CMD pairs, identified by PLACO. The height of each point represents the negative logarithm of the P-value estimated by PLACO, with the color bar indicating different chromosomes. The black dashed line represents the P-value threshold (a two-sided P < 1 × 10−5), and significant SNVs are labeled with text annotations. Right panel: Word cloud plots showing phenome-wide associations of these SNVs with clinical phenotypes. Sample Sizes: [diseases (case/N)]: Total CVDs (221,781/231,952); IHD (75,592/378,141); MI (28,546/378,019); Stroke (67,162/454,450); HF (47,309/930,014); T2D (71,728/369,007). FLTs food-liking traits, CMDs cardiometabolic diseases, LDSC linkage disequilibrium score regression, HDL high-definition likelihood, HF heart failure, T2D type 2 diabetes, PLACO the pleiotropic analysis under composite null hypothesis, INSIG independent significant, SNVs single-nucleotide variants, eQTL expression quantitative trait loci, MAGMA the gene-level multi-marker analysis of GenoMic annotation, SMR summary data-based Mendelian randomization, HEIDI heterogeneity in dependent instruments, rg genetic correlation, CVDs cardiovascular diseases, IHD ischemic heart disease, HF heart failure, MI myocardial infarction, T2D type 2 diabetes.
Fig. 6
Fig. 6. Gene mapping and druggability assessment.
a Circular dendrograms showing the mapped genes of pleiotropic genomic risk SNVs in different FLT and CMD pairs. The inner points represent the disease; the first circle represents related food liking; the second circle shows the pleiotropic genomic SNV regions; the third circle displays the mapped genes of pleiotropic genomic risk SNVs in each FLT and CMD pair. b Pleiotropic genes in different FLT and CMD pairs, identified through loci positions, MAGMA gene analysis, eQTLGen cis-eQTLs, eQTL-Whole Blood (GTEx v8), SMR-Whole Blood, SMR-eQTLGen analyses. FLTs food-liking traits, CMDs cardiometabolic diseases, SNVs single-nucleotide variants, MAGMA the gene-level multi-marker analysis of GenoMic annotation, eQTLGen cis-eQTLs the Cis-acting Expression Quantitative Trait Loci data generated by the eQTLGen Consortium, eQTL-whole blood (GTEx v8) expression quantitative trait loci for whole blood (from the Genotype-Tissue Expression Project version 8); SMR-eQTLGen, Summary data-based Mendelian Randomization with Expression Quantitative Trait Loci as reference data.
Fig. 7
Fig. 7. Shared biological pathways in different FLTs and CMDs pairs.
a Workflow for identifying shared biological pathways and tissue specificity in FLT and CMD pairs. b–d shared enriched biological pathways in different FLT and CMD pairs, identified by MAGMA gene-set analysis. The top pathways are presented for HF-Diet fizzy drinks, T2D-Bacon, and T2D-Lentils/beans. The red, green, blue, and brown pathways are respectively associated with immunoinflammatory responses, brain development, oxidative stress, and metabolic activity. Significantly enriched pathways, estimated by GSEA using Permutation Testing, were determined using a nominal threshold of two-sided P < 0.05. FLTs food-liking traits, CMDs cardiometabolic diseases, MAGMA the gene-level multi-marker analysis of GenoMic annotation, GSEA gene-set enrichment analysis, TSEA tissue-specific enrichment analysis.
Fig. 8
Fig. 8. Enriched biological pathways and tissue-specific enrichment analysis.
a–c shared enriched biological pathways in different FLT and CMD pairs, identified by Metascape analysis. The top pathways are presented for HF-Diet fizzy drinks, T2D-Bacon, and T2D-Lentils/beans. The red, green, blue, and brown pathways are associated with immunoinflammatory responses, brain development, oxidative stress, and metabolic activity. Significantly enriched pathways were determined using a nominal threshold of two-sided P < 0.05. d deTS tissue-specific enrichment analyses (TSEA) of pleiotropic genes using two different reference panels: GTEx and ENCODE were conducted (upper: MAGMA platform; lower left: deTS method with GTEx panel; lower right: deTS method with ENCODE panel). * Indicates a significant two-sided P < 0.05 in the analyses, estimated by Permutation Testing of TSEA. e Schematic diagram of the overall tissue-specific information in different FLT and CMD pairs. FLTs food-liking traits, CMDs cardiometabolic diseases, MAGMA the gene-level multi-marker analysis of genoMic annotation, GTEx Genotype-Tissue Expression project, ENCODE Encyclopedia of DNA Elements project, T2D type 2 diabetes. Created in BioRender. https://BioRender.com/viv2kjr.

References

    1. Berridge, K. C., Robinson, T. E. & Aldridge, J. W. Dissecting components of reward: ‘liking’, ‘wanting’, and learning. Curr. Opin. Pharmacol.9, 65–73 (2009). - PMC - PubMed
    1. Eertmans, A., Baeyens, F. & Van den Bergh, O. Food likes and their relative importance in human eating behavior: review and preliminary suggestions for health promotion. Health Educ. Res.16, 443–456 (2001). - PubMed
    1. Livingstone, K. M., Pnosamy, H., Riddell, L. J. & Cicerale, S. Demographic, behavioural and anthropometric correlates of food liking: a cross-sectional analysis of young adults. Nutrients12, 3078 (2020). - PMC - PubMed
    1. Breen, F. M., Plomin, R. & Wardle, J. Heritability of food preferences in young children. Physiol. Behav.88, 443–447 (2006). - PubMed
    1. Fildes, A. et al. Nature and nurture in children’s food preferences. Am. J. Clin. Nutr.99, 911–917 (2014). - PubMed

LinkOut - more resources