. 2025 May 24;16(1):4823.
doi: 10.1038/s41467-025-59970-1.

Interplay of kinetochores and catalysts drives rapid assembly of the mitotic checkpoint complex

Affiliations

Interplay of kinetochores and catalysts drives rapid assembly of the mitotic checkpoint complex

Suruchi Sethi et al. Nat Commun. .

Abstract

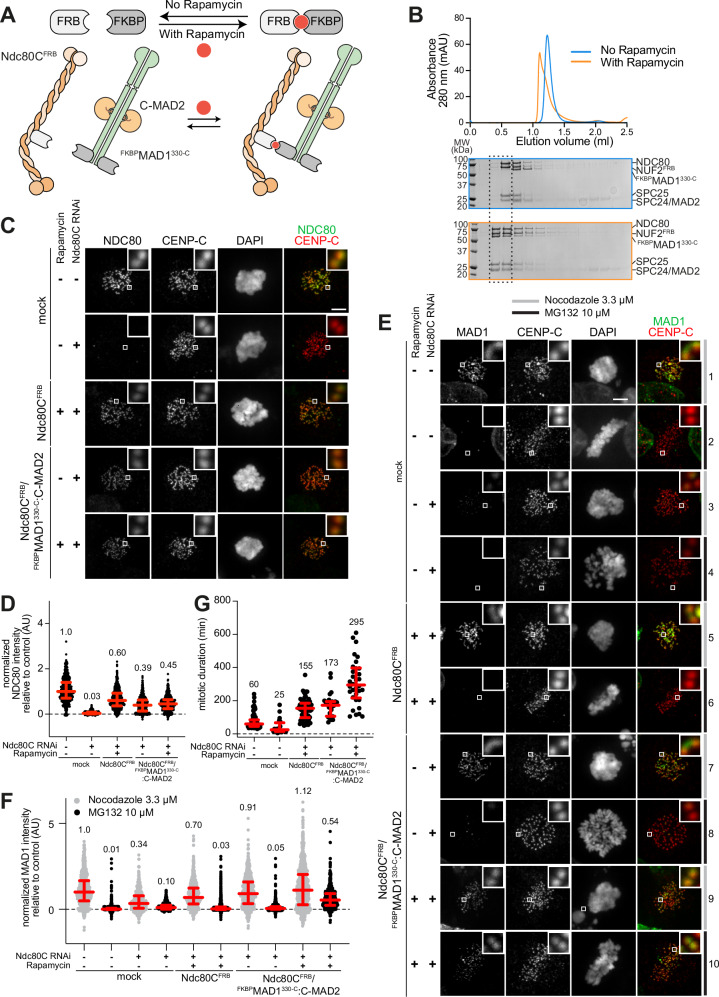
The spindle assembly checkpoint (SAC) ensures mitotic exit occurs only after sister chromatid biorientation, but how this coordination is mechanistically achieved remains unclear. Kinetochores, the megadalton complexes linking chromosomes to spindle microtubules, contribute to SAC signaling. However, whether they act solely as docking platforms or actively promote the co-orientation of SAC catalysts such as MAD1:MAD2 and BUB1:BUB3 remains unresolved. Here, we reconstitute kinetochores and SAC signaling in vitro to address this question. We engineer recombinant kinetochore particles that recruit core SAC components and trigger checkpoint signaling upon Rapamycin induction, and test their function using a panel of targeted mutants. At approximately physiological concentrations of SAC proteins, kinetochores are essential for efficient mitotic checkpoint complex (MCC) assembly, the key effector of SAC signaling. Our results suggest that kinetochores serve not only as structural hubs but also as catalytic platforms that concentrate and spatially organize SAC components to accelerate MCC formation and ensure timely checkpoint activation.


Conflict of interest statement

Competing interests: The authors declare no competing interests.

Figures

Fig. 1
Fig. 1. The outer kinetochore and catalysts promote SAC signaling.
A Scheme of catalytic assembly of MCC. Catalysts for MCC assembly are recruited to the outer kinetochore, consisting of Knl1C, Mis12C and Ndc80C. The catalysts recruit the MCC substrates and turn them into the product, the MCC, which diffuses away and binds and inhibits the APC/C. B Energy profile of MCC formation. Rate-limiting for MCC assembly is the association of CDC20:C-MAD2 from CDC20 and O-MAD2. It is spontaneous but slow due to the high activation energy. A bipartite assembly comprising BUB1:BUB3 and the MAD1:C-MAD2 core complex, activated by MPS1, catalyzes this association by lowering the energy barrier. MCC further incorporates BUBR1:BUB3 in a rapid spontaneous reaction. The hypothesis is that kinetochores (KT) further lower the activation energy. C Analysis of mitotic checkpoint functionality in cells depleted of the Ndc80C or the Knl1C. HeLa cells were arrested in the G2 phase of the cell cycle, released into mitosis in the presence of 33 nM Nocodazole and imaged 6 h after release. The percentage of mitotic cells is shown. Collectively, 678, 270, and 588 cells were analyzed for the control, Ndc80C RNAi, and Knl1C RNAi conditions, respectively, in three repeats of the experiment. The red line represents the median. Statistical analysis was performed with a two-sided non-parametric Mann-Whitney test comparing two unpaired groups; p-values were as follows: CTRL-Ndc80C RNAi p-value 0.0013 and CTRL-Knl1C RNAi p-value 0.0079. Scale bar = 10 µm.
Fig. 2
Fig. 2. Engineering MAD1 recruitment.
A Scheme of FRB and FKBP dimerization through Rapamycin (red circle). With Rapamycin FKBPMAD1330-C:C-MAD2 binds FRB fused C-terminally to NUF2 in Ndc80CFRB. B Elution profiles and SDS PAGE of fractions of SEC experiments on Superose 6 5/150 column with stoichiometric FKBPMAD1330–718:C-MAD2 and Ndc80CFRB (3 μM) with/without 10 µM Rapamycin. Representative elution profile from three repeats. C Immunofluorescence of HeLa cells treated with Rapamycin 500 nM or Ndc80C RNAi (see “Methods”) and electroporated as indicated (Ndc80CFRB or Ndc80CFRB/FKBPMAD1330-C:C-MAD2). CENP-C is a kinetochore resident. Scale bar 5 µm. D Kinetochore levels of endogenous Ndc80C or Ndc80CFRB normalized to endogenous levels (no RNAi, no Rapamycin). Number of kinetochores from two independent experiments: n = 553 for control, n = 709 for Ndc80C RNAi, n = 642 for Ndc80CFRB, n = 565 for Ndc80CFRB/FKBPMAD1330-C:C-MAD2 no Rapamycin, n = 545 for Ndc80CFRB/FKBPMAD1330-C:MAD2 with Rapamycin. Here and in panel F, red bars represent median, indicated above the plots, and interquartile range of normalized single kinetochore intensities. E Immunofluorescence of HeLa cells treated with Rapamycin or Ndc80C RNAi and electroporated as indicated (Ndc80CFRB or Ndc80CFRB/FKBPMAD1330-C:C-MAD2). Localization of MAD1 was compared in SAC-on cells (Nocodazole, conditions 1, 3, 5, 7, and 9) or SAC-off cells (MG132, conditions 2, 4, 6, 8, and 10). Scale bar 5 µm. F Quantification of MAD1 normalized to endogenous levels. Number of kinetochores from two independent experiments: n = 728 for condition 1, n = 1487 for 2, n = 630 for 3, n = 871 for 4, n = 658 for 5, n = 1069 for 6, n = 758 for 7, n = 768 for 8, n = 898 for 9, n = 714 for 10. G Duration of mitosis in HeLa cells treated with Rapamycin or Ndc80C RNAi as described (see Methods) and electroporated as indicated (Ndc80CFRB or Ndc80FRB/FKBPMAD1330-C:C-MAD2). Cells arrested in G2 phase were released into mitosis and imaged for 18 h. Mitotic duration was measured using cell morphology and DNA condensation in two independent experiments. Red bars represent median with interquartile range. Cells analyzed in two independent experiments: n = 113 for control, n = 21 for Ndc80C RNAi, n = 74 for Ndc80CFRB, n = 29 for Ndc80CFRB/FKBPMAD1330-C:C-MAD2 no Rapamycin, n = 35 for Ndc80CFRB/FKBPMAD1330-C:C-MAD2 with Rapamycin.
Fig. 3
Fig. 3. Engineering KNL1.
A Scheme of motifs and domains of human KNL1. Numbering is according to isoform 2 of KNL1 (residues 1-2316, with residues 84-109 missing relative to the more canonical isoform 1 of 2342 residues). We opted to use isoform 2 numbering to facilitate a comparison with previously used constructs. KI1 and KI2, lysine (K) – isoleucine (I) motifs; MELT, methionine (M) – glutamic acid (E) – leucine (L) – threonine (T) motifs. The KNL1C fragment contains tandem RWD domains (RING finger-containing proteins, WD-repeat-containing proteins and yeast DEAD (DEXD)-like helicases). B Strategy for generating KNL1Bonsai through fusion of fragments fused to SpyTag or SpyCatcher. The KNL1M5 fragment is an engineered fusion of residues 138-250 and 818-1051. The fusion reaction was performed at least three times with essentially identical results. C Scheme of solid phase binding assay monitoring interactions of outer kinetochore and SAC proteins. D KNL1C and KNL1Bonsai bind Mis12C immobilized on solid phase, whereas only traces of KNL1M5 were detected, as expected. This experiment and the experiment in panel E are representative of three repeats. E SDS PAGE result of pulldown with GST-CENP-C1–71 and RKT with NUF2FRB (3 μM) testing for binding of FKBPMAD1:C-MAD2 (6 μM) with or without Rapamycin.
Fig. 4
Fig. 4. KMN supports catalytic MCC assembly.
A Scheme of catalysts, RKT, and FRET sensor monitoring MCC assembly,. CFPBUBR1 and O-MAD2TAMRA are donor and acceptor, respectively. CFP and TAMRA are closely positioned in MCC, allowing FRET (quantified as sensitized TAMRA fluorescence emission). B Sensitized fluorescence emission (FRET) normalized to curve’s maximum for MCC sensor in presence of indicated concentration of MPS1-pre-phosphorylated catalysts, and supplemented with (blue) or without (red) pre-phosphorylated RKTs (20 nM) in presence of 200 nM Rapamycin. ATP (2 mM) and MgCl2 (10 mM) were added before starting the experiment. All catalytic components were pre-phosphorylated with MPS1. In all FRET experiments, the Y-axis represents fluorescence emission intensity of FRET acceptor, indicated as “Normalized FRET signal (AU)”. AU is arbitrary units, and we show it to emphasize the original signal was in arbitrary units. The blue and red curve were normalized to their own maximum. C Sensitized fluorescence emission (FRET) normalized to curve’s maximum for MCC sensor in presence of indicated concentrations of MPS1-pre-phosphorylated catalysts. RKTs were omitted. Dark blue and purple curves did not plateau during observation and their values were normalized to the maximum value of the light brown-color curve. D Sensitized fluorescence emission (FRET) of MCC sensor in the presence of unphosphorylated catalysts (50 nM MPS1; 20 nM FKBPMAD1330-C:C-MAD2; 40 nM BUB1:BUB3) and unphosphorylated RKT (20 nM). The blue curve (also shown in F and in Supplementary Fig. 1G) was normalized to its own maximum. Fluorescence values of the other curves were normalized to the maximum value of the blue curve. The gray curve is also shown in Supplementary Fig. 1G. E Variants of the RKT used for controls in F. F Sensitized fluorescence emission (FRET) of MCC sensor in the presence of unphosphorylated catalysts (same concentration as in D, unphosphorylated RKT (same curve as in panel D), and the RKT variants presented in E. Fluorescence values were normalized to maximum of the blue curve. Panels reporting time-dependent changes in FRET signal are from single measurements and representative of at least three independent technical replicates of the experiment.
Fig. 5
Fig. 5. KNL1Bonsai brings BUB1:BUB3 in proximity of MAD1:MAD2.
A Scheme of GST pulldown assays with GSTCENP-C1–71 and RKT (3 µM) assembled with the indicated versions of Knl1C and further incubated with BUB1:BUB3 (10 µM) as pray. B SDS PAGE of pulldown experiment schematized in A and containing GSTCENP-C1–71 and RKT at 3 µM with different KNL1 mutants and BUB1:BUB3 at 10 µM as indicated above each lane. The asterisks indicate excess of KNL1M5 fragments not fused to KNL1C. The experiment was performed three times with essentially identical results. C Sensitized fluorescence emission (FRET) of MCC sensor in the presence of unphosphorylated catalysts and unphosphorylated RKT containing the indicated KNL1 variants, supplemented at the same concentrations used in Fig. 4D. The blue curve was normalized to its maximum. The other curves did not plateau during the experiment and were normalized to the maximum of the blue curve. D Sensitized fluorescence emission (FRET) of MCC sensor in the presence of unphosphorylated catalysts and unphosphorylated RKT containing the additional indicated KNL1 variants, supplemented at the same concentrations used in Fig. 4D. The blue and orange curves were normalized to their own maximum. The gray and purple curves were normalized to the maximum of the blue curve. Panels reporting time-dependent changes in FRET signal are from single measurements and representative of at least three independent technical replicates of the experiment.
Fig. 6
Fig. 6. Influence of BUB1:BUB3 interaction with other SAC components in catalysis.
A Scheme of pulldown assays with GSTCENP-C1–71, RKT or RKT assembled with KNL1C (rather than KNL1Bonsai, each at 3 μM), and prays including BUB1:BUB3 (10 μM), CFPBUBR1:BUB3 (8 μM), and CDC20 (6 μM). B SDS PAGE of pulldowns with baits and preys indicated above each lane. Pre-phosphorylation of the RKTs species by MPS1 (50 nM) is indicated with (P). Coomassie staining is shown above in-gel fluorescence (488 nm) below. All baits were incubated with an at least 3-fold molar excess of BUB1:BUB3, CFPBUBR1:BUB3 and CDC20. Efficient phosphorylation of KNL1 and KNL1KI1+2/AA was confirmed by a shift in migration in SDS-PAGE of the KNL1 band. No shift of KNL1M5-A upon phosphorylation with MPS1 was observed. The experiment was performed three times with essentially identical results. C Scheme of the experimental setup of the following assays. D MCC FRET assay monitoring the assembly of MCC without pre-phosphorylation of the components by MPS1, in the presence of catalysts and Rapamycin, and with RKT (blue curve, also shown in E or without RKT (light brown curve, also shown in E. Where indicated, the BUB1∆helix mutant replaced wild-type BUB1 and was tested with RKT (thistle curve) or without RKT (pink curve). E MCC FRET assay monitoring the assembly of MCC without pre-phosphorylation of the components by MPS1, in the presence of catalysts and Rapamycin, and with RKT (blue curve, also shown in D or without RKT (light brown curve, also shown in D. Where indicated, the BUB1KEN-ABBA mutant replaced wild-type BUB1 and was tested with RKT (dark brown curve) or without RKT (dark blue curve). F MCC FRET assay monitoring the assembly of MCC without pre-phosphorylation of the components by MPS1, in the presence of catalysts and Rapamycin, and with RKT (blue curve, also shown in Fig. 7A and C) or without RKT (light brown curve). Where indicated, the BUB1∆CM1 mutant replaced wild-type BUB1 and was tested with RKT (light blue curve) or without RKT (salmon curve). Panels reporting time-dependent changes in FRET signal are from single measurements and representative of at least three independent technical replicates of the experiment.
Fig. 7
Fig. 7. BUB1 and MAD1:C-MAD2 are an integrated platform for catalytic MCC assembly by MPS1.
A MCC FRET assay monitoring the assembly of MCC without pre-phosphorylation of the components by MPS1, in the presence of the catalysts and Rapamycin, and with RKT (blue curve, already shown in Fig. 6F), without MPS1 (gray curve, also shown in C and in the presence of the MPS1 inhibitor Reversine (brown curve). B Schematic representation of the experimental setup of the following assays. C MCC FRET assay monitoring the assembly of MCC without pre-phosphorylation of the components by MPS1, in the presence of Rapamycin and RKT (blue curve, already shown in Fig. 6F), and with wild-type or mutant catalysts: BUB1S459A-T461A (green curve), MAD1T716A (purple curve), both BUB1S459A-T461A and MAD1T716A (yellow curve), or without MPS1 (gray curve, already shown in A. Panels reporting time-dependent changes in FRET signal are from single measurements and representative of at least three independent technical replicates of the experiment. D) Schematic representation of the assembly of the catalytic scaffold on the engineered outer kinetochore, highlighting the crucial binding interfaces and phosphorylation sites for efficient MCC formation.

Similar articles

References

    1. Cheeseman, I. M. The kinetochore. Cold Spring Harb. Perspect. Biol.6, a015826 (2014). - PMC - PubMed
    1. Musacchio, A. & Desai, A. A molecular view of kinetochore assembly and function. Biology (Basel)6, 10.3390/biology6010005 (2017). - PMC - PubMed
    1. McAinsh, A. D. & Kops, G. Principles and dynamics of spindle assembly checkpoint signalling. Nat. Rev. Mol. Cell Biol.24, 543–559 (2023). - PubMed
    1. Musacchio, A. The molecular biology of spindle assembly checkpoint signaling dynamics. Curr. Biol.25, R1002–R1018 (2015). - PubMed
    1. Fischer, E. S. Kinetochore-catalyzed MCC formation: A structural perspective. IUBMB Life75, 289–310 (2023). - PMC - PubMed

MeSH terms

LinkOut - more resources