. 2025 May 23;16(1):4794.
doi: 10.1038/s41467-025-60107-7.

Linker-free PROTACs efficiently induce the degradation of oncoproteins

Affiliations

Linker-free PROTACs efficiently induce the degradation of oncoproteins

Jianchao Zhang et al. Nat Commun. .

Abstract

Proteolysis-targeting chimeras (PROTACs) present a potentially effective strategy against various diseases via selective proteolysis. How to increase the efficacy of PROTACs remains challenging. Here, we explore the necessity of the linker, which has been deemed as an integral part of heterobifunctional PROTACs. Adopting single amino acid-based degradation signals, we find that the linker is not a required feature of the PROTACs. Notably, the linker-free PROTAC, Pro-BA, exhibits superior efficacy over its linker-bearing counterparts in degrading EML4-ALK and inhibiting lung cancer cell growth, as Pro-BA induces a stronger interaction between the target and the E3 ubiquitin ligase. Pro-BA is a water-soluble, orally administered degrader that significantly inhibits the tumor growth in a xenograft mouse model. The broad applicability of this linker-free PROTAC strategy is further validated through the development of BCR-ABL degrader. Our study introduces a design paradigm for PROTACs, potentially facilitating the advancement of more efficient therapeutic degraders.


Conflict of interest statement

Competing interests: H.R., J.Z., and L.F. are co-inventors on a patent application related to the PROTACs described in this paper (applicant: Southern University of Science and Technology; Shenzhen Institute of Advanced Technology, Chinese Academy of Sciences; inventors: H.R., J.Z., and L.F.; application number: PCT/CN2024/129836). The other authors declare no competing interests.

Figures

Fig. 1
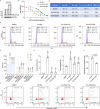
Fig. 1. Linker-free AATacs mediate the degradation of EML4-ALK.
A The schematic designs of Pro-BA, Gly-BA and Arg-BA. B H3122 cells were exposed to Pro-BA, Gly-BA, or Arg-BA at the specified concentrations for 48 h, and protein levels of EML4-ALK and GAPDH were assessed by immunoblotting. C H3122 cells were separately treated with Pro-BA or Gly-BA at the indicated concentration for 24 h, followed by immunoblot analysis of EML4-ALK and GAPDH protein expression (left panel). The plots were utilized to determine the half-maximal degradation concentration (DC50) values by quantifying EML4-ALK protein levels (right panel). D Summary of DC50 values—defined as the drug concentration resulting in 50% protein degradation, Dmax values—defined as the maximum degradation percentage relative to control, IC50 values—defined as the half maximal inhibitory concentration, and T1/2 values- defined as the time leading to 50% protein degradation for Pro-BA and Gly-BA. E H3122 cell viability was determined utilizing CCK-8 assays after 48 h of treatment with different concentrations of Pro-BA and Gly-BA. F Immunoblot analysis was performed on H3122 cells treated with 250 nM Pro-BA or Gly-BA for different time intervals (left panel). The curves were analyzed to calculate T1/2 values based on the quantification of EML4-ALK protein levels (right panel). G Quantitative proteomics analysis in H3122 cells after treatment with DMSO or 500 nM Pro-BA for 12 h. Data are presented as the log2 fold change (FC) in protein abundance (x-axis) versus the -log10 adjusted p value (y-axis) for each protein, derived from quadruplicate experiments. Two-sided moderated t-test p values were calculated using the LIMMA package, and the horizontal line represents an adjusted p value threshold of 0.05. For (C), (E), (F), the data are shown as mean ± SD derived from three independent experiments. Source data are provided as a Source Data file.
Fig. 2
Fig. 2. Linker-free Pro-BA outperforms the linker-containing degraders in vitro.
A H3122 cells were incubated with Pro-BA, Pro-PEG1-BA and Pro-PEG3-BA separately at 100 nM for 48 h. The expression levels of EML4-ALK and GAPDH were assessed by immunoblotting. B H3122 cell viability was measured via CCK-8 assays following a 48-hour exposure to Pro-BA, Pro-PEG1-BA, and Pro-PEG3-BA at various concentrations. Data is represented as mean ± SD of three independent experiments. C Summary of DC50, Dmax, IC50 values, and molecular weight (MW) for the indicated compounds. D H3122 cells were exposed to Pro-BA, Pro-PEG1-BA, or Pro-PEG3-BA at 500 nM for 24 h, and cell cycle distribution was assessed using flow cytometry. E The bar graph illustrates the percentage of H3122 cells in the G1, S, and G2 phases as shown in (D). F H3122 cells were treated with Pro-BA, Pro-PEG1-BA or Pro-PEG3-BA at 500 nM for 24 hours, and apoptosis was assessed using flow cytometry. G The bar graph shows the percentages of early (left) and late (right) apoptotic cells, as indicated by the Q3 and Q2 quadrants in (F), respectively. H H3122 cells were treated with 5 μM Pro-BA or Pro-PEG3-BA for 5 h. UHPLC-MS/MS analysis of intracellular amounts of Pro-BA and Pro-PEG3-BA per 5 × 106 cells. Data are presented as mean ± SD from three independent experiments, two-tailed Student’s t-test. For (E), (G), data are presented as the mean ± SD (n = 3 independent experiments). Statistical analysis was performed using one-way ANOVA followed by Fisher’s LSD test (two-tailed). The gating strategies for flow cytometry analysis are shown in Supplementary Fig. 8. Source data are provided as a Source Data file.
Fig. 3
Fig. 3. Pro-BA shows enhanced antitumor activity compared to the corresponding degraders with linkers in vivo.
A H3122 cells were grafted into the right flank of 4-week-old female nude mice. The mice were treated with vehicle, Brigatinib, Pro-PEG3-BA, or Pro-BA at dose of 10 mg/kg, prepared in a solution of 90% corn oil + 10% DMSO via I.P. route every other day for a total of 8 administrations. Tumors were harvested from each group and photographed. B The bar graphs represent the mean ± SD of the primary tumor volumes of mice in (A). C The graph depicts the mean tumor growth of mice in (A), with treatment intervals marked by black arrows. D Analysis of EML4-ALK protein levels in tumor samples from (A) using immunoblotting. E Quantitative analysis of the Western blot results presented in (D). Data are presented as the mean ± SD (n = 5 mice per group). Statistical analysis was performed using one-way ANOVA followed by Fisher’s LSD test (two-tailed) for pairwise comparisons. F The graph illustrates the average body weight of mice receiving I.P. administration as described in (C). For (B), (C) data are presented as the mean ± SD (n = 5 mice per group). Statistical analysis was performed using Brown-Forsythe and Welch ANOVA followed by Welch’s t-tests (two-tailed) due to unequal variances (p < 0.05). Source data are provided as a Source Data file.
Fig. 4
Fig. 4. Pro-BA facilitates EML4-ALK degradation through the ubiquitin-proteasome system.
A H3122 cells were treated with Pro-BA alone or in combination with MG132 (10 µM) or CQ (25 µM), for 6 h. The protein levels of EML4-ALK and GAPDH were subsequently assessed by immunoblotting (upper panel). The bar graph presents a quantitative analysis of EML4-ALK protein levels derived from three independent replicates shown in Fig. 4A and Supplementary Fig. 4A (lower panel). B H3122 cells were treated with cycloheximide (CHX) alone, or in combination with Pro-BA, or with both Pro-BA (100 nM) and MG132 (10 µM) for different time intervals, followed by immunoblotting to measure EML4-ALK and GAPDH expression (upper panel). Quantitative analysis of the Western blot results for EML4-ALK from three separate repeats is presented in Fig. 4B and Supplementary Fig. 4B (lower panel). C Immunoblot analysis was conducted on H3122 cells pre-treated with BA (10 μM) for 2 h and then incubated with Pro-BA (100 nM) for 12 h to assess the expression of specific proteins (upper panel). The bar graph presents a quantitative analysis of EML4-ALK protein levels derived from three independent experiments shown in Fig. 4C and Supplementary Fig. 4C (lower panel). D H3122 cells with stable expression of the indicated sgRNA were exposed to either DMSO or Pro-BA for 24 h, and the levels of the indicated protein were assessed by immunoblotting. E HEK293T cells co-expressing HA-GID4 and Flag-EML4-ALK were treated with DMSO, Pro-BA (500 nM), or Brigatinib (500 nM) for 24 h. The cells were then subjected to immunoprecipitation using anti-FLAG® M2 Magnetic Beads, followed by immunoblotting with the specified antibodies. F HEK293T cells coexpressing HA-GID4, Flag-EML4-ALK, and myc-Ub were incubated with DMSO, Pro-BA (500 nM), or Brigatinib (500 nM) for 24 h, then treated with MG132 (10 μM) for 4 h. Ubiquitylation of Flag-EML4-ALK was analyzed by denaturing immunoprecipitation (IP) with an anti-myc-tag antibody. G ITC measurement of the affinity of Pro-BA (left) and Pro-PEG3-BA (right) with ALK (1094-1400 aa). H HEK293T cells co-transfected with pHTN-GID4 and pNLF1-N-ALK were exposed to Brigatinib, Pro-BA, or Pro-PEG3-BA at the indicated concentration for 6 h. Data represented as normalized NanoBRET ratio. Data are presented as the mean ± SD (n = 3 independent experiments). Statistical analysis was performed using one-way ANOVA followed by Fisher’s LSD test (two-tailed) for pairwise comparisons. I HEK293T cells coexpressing HA-GID4 and Flag-EML4-ALK were incubated with DMSO, Pro-BA (500 nM), Pro-PEG3-BA (500 nM), or Brigatinib (500 nM) for 24 h, respectively. After immunoprecipitation with anti-FLAG® M2 Magnetic Beads, followed by immunoblotting with various antibodies indicated. J HEK293T cells coexpressing HA-GID4, Flag-EML4-ALK, and myc-Ub were treated with DMSO, Pro-BA (500 nM), Pro-PEG-BA (500 nM), or Brigatinib (500 nM) for 24 h, followed by the addition of MG132 (10 μM) for 4 h. Ubiquitination of Flag-EML4-ALK was examined by denaturing immunoprecipitation (IP) with anti-myc-tag antibody. For (AC), data are shown as the mean ± SD (n = 3 independent experiments), two-tailed Student’s t-test. Source data are provided as a Source Data file.
Fig. 5
Fig. 5. In vivo PK and PD studies of Pro-BA.
A Pro-BA was administered to mice at a dose of 2 mg/kg in ddH2O via I.V. injection and 10 mg/kg in ddH2O via P.O. route, respectively. Plasma drug concentrations were assessed utilizing HPLC. Data are presented as the mean ± SD (n = 3 mice per group). B PK parameters of Pro-BA following a single dose via I.V. injection (2 mg/kg) and P.O. route (10 mg/kg). C H3122 tumor-bearing nude mice received either vehicle (ddH2O) or Pro-BA (10 mg/kg in ddH2O) via P.O. route. Tumor tissues were collected and analyzed by immunoblotting to detect indicated proteins after 48 h of treatment (upper panel). The corresponding quantification of protein levels from the western blot data is provided (lower panel). Data are presented as the mean ± SD (n = 3 mice per group), two-tailed Student’s t-test. Source data are provided as a Source Data file.
Fig. 6
Fig. 6. Pro-BA is an orally effective antitumor degrader.
A H3122 cells were implanted into the right flank of 4-week-old female nude mice. The mice were treated with vehicle (ddH2O) and Pro-BA (25 mg/kg in ddH2O) through P.O. route every two days for a total of 8 administrations. The tumors were then surgically extracted and photographed. B The bar graph illustrates the mean ± SD of the primary tumor volumes of mice in (A). C The graph depicts the average tumor growth of mice in (A), delineated by black arrows for the treatment time points. Data is presented as the mean ± SEM (n = 5 mice per group), two-tailed Student’s t-test. D Representative immunohistochemical staining of EML4-ALK in tumor sections of mice from (A), scale bar: 100 μm. E Immunoblot analysis of EML4-ALK protein levels was performed in tumor samples collected on day 16 following the initiation of oral administration (left panel). The bar graph provides a quantitative analysis of EML4-ALK protein levels based on the western blot images (right panel). F The graph illustrates the average body weight of mice administered via the oral route as described in (C). Data is shown as the mean ± SD (n = 5 mice per group), two-tailed Student’s t-test. G Representative H&E staining of organs (heart, liver, spleen, lung, and kidney) from H3122 tumor-bearing mice administered orally with vehicle or Pro-BA, scale bar: 100 μm. For (B), (E) data are presented as the mean ± SD (n = 5 mice per group), two-tailed Student’s t-test. Source data are provided as a Source Data file.
Fig. 7
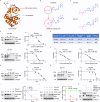
Fig. 7. Characterization of BCR-ABL-targeting linker-free degraders.
A Crystal structure of ABL in complex with Dasatinib (PDB: 2GQG). B The structures of Dasatinib and Dasatinib analog (DA). C The structures of Pro-DA and Gly-DA. D K562 cells were separately treated with Pro-DA or Gly-DA at the indicated concentration for 48 h, followed by immunoblot analysis of BCR-ABL and GAPDH protein expression (left panel). The plots were utilized to determine the DC50 values by quantifying BCR-ABL protein levels (right panel). E Summary of DC50, Dmax, IC50, T1/2 values, and molecule weight (MW) for Pro-DA and Gly-DA. F K562 cell viability was assessed using CCK-8 assays following a 48-h treatment with varying concentrations of Pro-DA and Gly-DA. G, H Immunoblot analysis was performed on K562 cells treated with Pro-DA (G) and Gly-DA (H) at 20 nM for various time points (left panel). The curves were used to calculate the T1/2 values of Pro-DA (G) and Gly-DA (H) by quantifying BCR-ABL protein levels (right panel). I K562 cells were exposed to 10 nM Pro-DA for 30 h, followed by incubation with CHX (100 μg/mL) at specified time points. BCR-ABL stability was assessed by immunoblotting (left panel), and the intensity of BCR-ABL protein bands was quantified (right panel). J K562 cells were treated with 20 nM Pro-DA for 30 h, then CHX (100 μg/mL) was added for the indicated times in the presence or absence of MG132. BCR-ABL stability was evaluated by immunoblotting (left panel), with band intensity quantified (right panel). K K562 cells with stable expression of sgCon, sgGID4-1#, or sgGID4-2# were incubated with DMSO or Pro-DA (20 nM) for 48 h, and the indicated protein levels were assessed by immunoblotting. For (D), (F), (G), (H), (I), (J), the data are shown as mean ± SD derived from three independent experiments. Source data are provided as a Source Data file.

Similar articles

References

    1. He, M. et al. PROTACs: great opportunities for academia and industry (an update from 2020 to 2021). Signal. Transduct. Target. Ther.7, 1–64 (2022). - PMC - PubMed
    1. Sathe, G. & Sapkota, G. P. Proteomic approaches advancing targeted protein degradation. Trends Pharmacol. Sci.44, 786–801 (2023). - PubMed
    1. Békés, M., Langley, D. R. & Crews, C. M. PROTAC targeted protein degraders: the past is prologue. Nat. Rev. Drug Discov.21, 181–200 (2022). - PMC - PubMed
    1. Sasso, J. M. et al. Molecular glues: the adhesive connecting targeted protein degradation to the clinic. Biochemistry62, 601–623 (2022). - PMC - PubMed
    1. Dewey, J. A. et al. Molecular glue discovery: current and future approaches. J. Med. Chem.66, 9278–9296 (2023). - PMC - PubMed

MeSH terms