. 2025 May 23;11(1):40.
doi: 10.1038/s41514-025-00237-w.

Metabolomics biomarkers of frailty: a longitudinal study of aging female and male mice

Affiliations

Metabolomics biomarkers of frailty: a longitudinal study of aging female and male mice

Dantong Zhu et al. NPJ Aging. .

Abstract

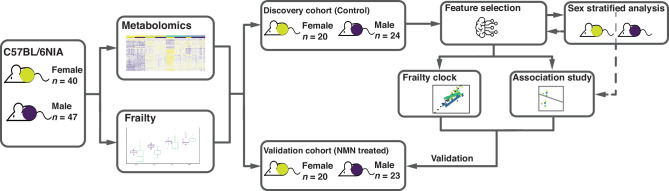
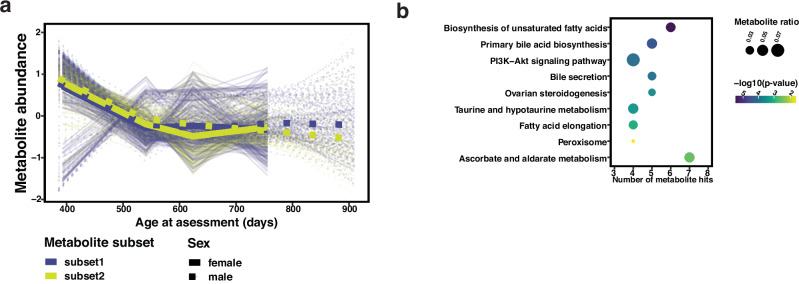
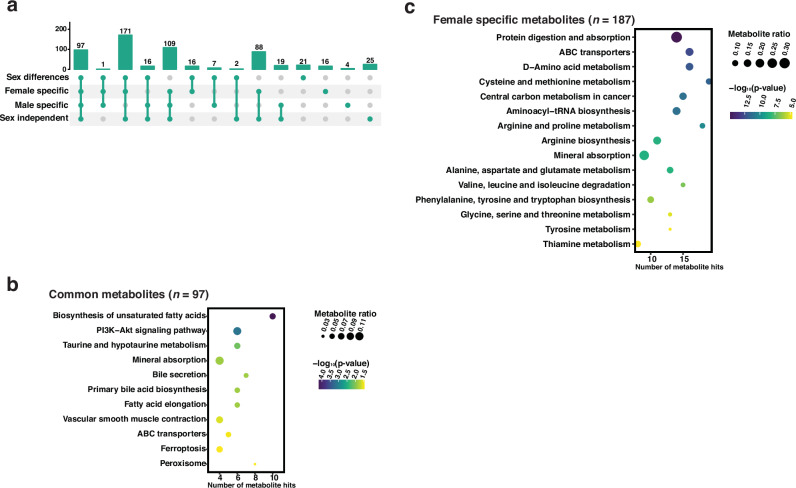
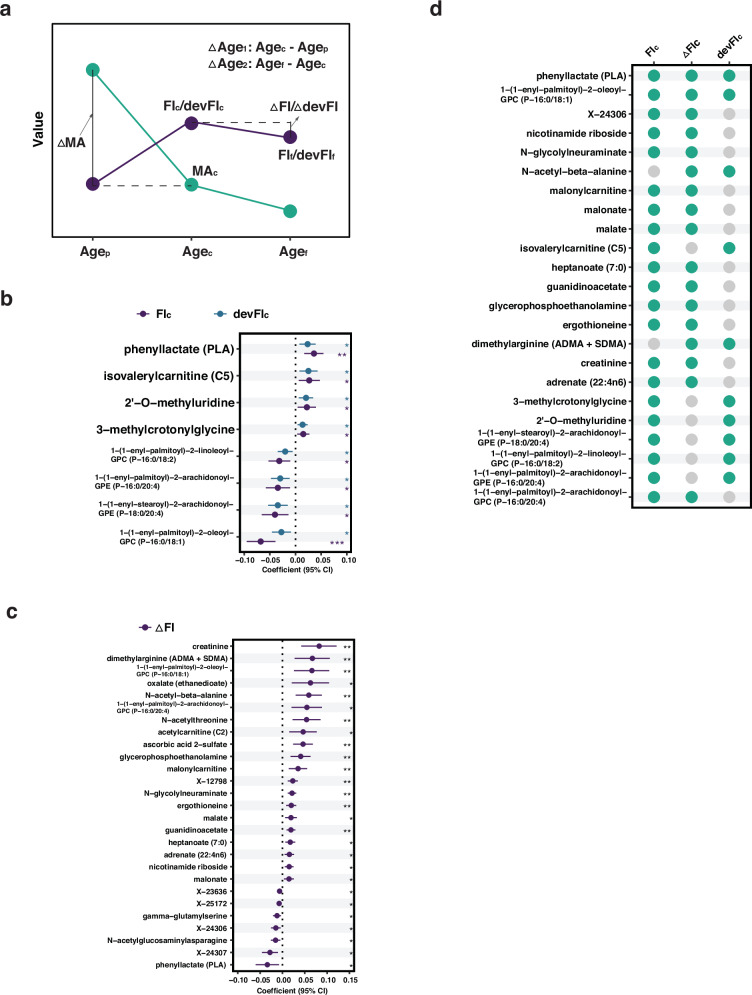
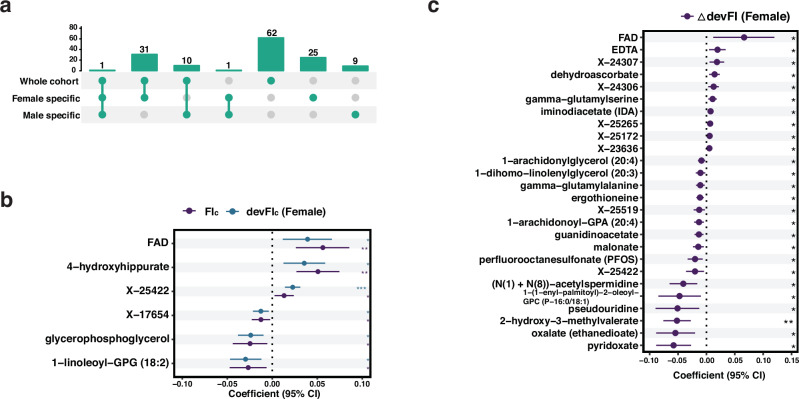
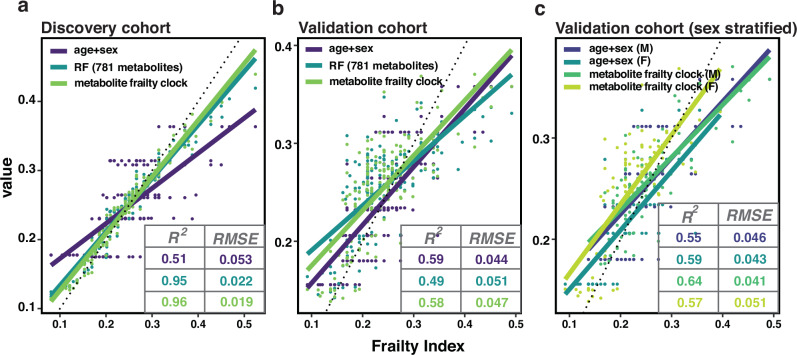
Frailty is an age-related geriatric syndrome. We performed a longitudinal study of aging female (n = 40) and male (n = 47) C57BL/6NIA mice, measured frailty index and derived metabolomics data from plasma. We identify age-related differentially abundant metabolites, determine frailty-related metabolites, and generate frailty features, both in the whole cohort and sex-stratified subgroups. Using the features, we perform an association study and build a metabolomics-based frailty clock. We find that frailty-related metabolites are enriched for amino acid metabolism and metabolism of cofactors and vitamins, include ergothioneine, tryptophan and alpha-ketoglutarate, and present sex dimorphism. We identify B vitamin metabolism related flavin-adenine dinucleotide and pyridoxate as female-specific frailty biomarkers, and lipid metabolism related sphingomyelins, glycerophosphoethanolamine and glycerophosphocholine as male-specific frailty biomarkers. These associations are confirmed in a validation cohort, with ergothioneine and perfluorooctanesulfonate identified as robust frailty biomarkers. Our results identify sex-specific metabolite frailty biomarkers, and shed light on potential mechanisms.


Conflict of interest statement

Competing interests: D.A.S. is a founder, equity owner, advisor to, director of, board member of, consultant to, investor in and/or inventor on patents licensed to Revere Biosensors, UpRNA, GlaxoSmithKline, Wellomics, DaVinci Logic, InsideTracker (Segterra), Caudalie, Animal Biosciences, Longwood Fund, Catalio Capital Management, Frontier Acquisition Corporation, AFAR (American Federation for Aging Research), Life Extension Advocacy Foundation (LEAF), Cohbar, Galilei, EMD Millipore, Zymo Research, Immetas, Bayer Crop Science, EdenRoc Sciences (and affiliates Arc-Bio, Dovetail Genomics, Claret Bioscience, MetroBiotech, Astrea, Liberty Biosecurity and Delavie), Life Biosciences, Alterity, ATAI Life Sciences, Levels Health, Tally (aka Longevity Sciences) and Bold Capital. D.A.S. is an inventor on a patent application filed by Mayo Clinic and Harvard Medical School that has been licensed to Elysium Health. Additional info on D.A.S. affiliations can be found at https://sinclair.hms.harvard.edu/david-sinclairs-affiliations . The other authors declare no competing interests.

Figures

Fig. 1
Fig. 1. Schematic diagram of the workflow.
The longitudinal study starts with female (n = 40, yellow circles) and male (n = 47, blue circles) C57BL/6NIA mice. Frailty was assessed and blood samples were collected at 5 time points from BL to T5 (exact days of (experiments are shown in Table 1). Plasma samples were derived from blood samples and were then subjected to metabolite quantification. In order to investigate metabolites related with natural aging and frailty, feature selection, sex stratified analysis, association study and the frailty clock were all performed in the control samples without intervention as the discovery cohort. The metabolite biomarkers and a metabolite clock for frailty were then tested in the validation cohort.
Fig. 2
Fig. 2. Sex independent age-related differentially abundant metabolites in longitudinal study.
Differential abundance analysis was performed using all samples (excluding time point T5) in the study. Sex-independent age-related differentially abundant metabolites (DAMs) were selected from comparisons of the mixture of female and male samples at different time points and by controlling for a 5% Benjamini–Hochberg false discovery rate (adjusted p-values < 0.05). These DAMs were then subjected to a co-abundance analysis, and subset1 and subset2 were determined to be significantly associated with age by linear mixed models. a Dynamics of metabolite abundance in each sex, derived from two subsets (subset1, n = 200 metabolites; subset2, n = 125). After determining the hub metabolites based on metabolite correlation with age and module membership, hub metabolites were subjected to metabolite set enrichment analysis. b Over-represented pathways (y-axis) from the hub metabolites from the two subsets. The number of hits (metabolite) from the hub metabolites set is shown by x-axis, ratio of the hit number to total metabolites in the enriched pathway is represented by dot size and p-value is colored by levels.
Fig. 3
Fig. 3. Comparisons of differentially abundant metabolites determined in four groups.
Differential abundance analysis was performed using all samples (excluding time point T5) in the study. Age-related differentially abundant metabolites (DAMs) were determined by comparisons within four groups: the mixture of females and males (sex independent), female specific, male specific, and sex differences, and by controlling for a 5% Benjamini–Hochberg false discovery rate (adjusted p-values < 0.05). a UpSet plot showing the common DAMs derived from the comparisons. b Over-represented pathways (y-axis) from the 97 common metabolites of four groups by metabolite set enrichment analysis. c Over-represented pathways (y-axis) from the 187 female-specific metabolites markers that also present sex differences. The number of hits (metabolite) from the hub metabolites set is shown by x-axis, ratio of the hit number to total metabolites in the enriched pathway is represented by dot size and p-value is colored by levels.
Fig. 4
Fig. 4. Selection of frailty-related features.
a Schematic diagram for the workflow of the feature selection. Frailty index (FI) is composed of base FI and devFI (deviation from the age- and sex- group median FI). Base FI is age related, hence leads to age metabolites. FI and devFI metabolites are derived from elastic net regularization regression via a 100 times repeated 5-fold cross validation approach. FI metabolites are merged with age metabolites into FI-age features and with devFI metabolites into devFI features. The FI-union features are the union of FI-age and devFI features. The workflow is performed in the whole cohort, as well as females and males after the stratification by sex. b UpSet plot showing the overlapping metabolite features from the FI-, age- and devFI- metabolites. c Over-represented pathways (y-axis) from the 104 FI-union features from the whole cohort. The number of hits (metabolite) from the hub metabolites set is shown by x-axis, ratio of the hit number to total metabolites in the enriched pathway is represented by dot size and p-value is colored by levels.
Fig. 5
Fig. 5. Association study in the whole cohort.
a Schematic diagram showing the dependent and independent variables in the linear mixed models for the association study. Dependent variables include Frailty Index (FIc) and devFI (devFIc, deviation from median FI of the age- and sex- specific group) at the current age (agec), FI and devFI (FIf/devFIf) at a future age (agef), and FI/devFI change from agec to agef (∆FI/∆devFI). Independent variables include current abundance of metabolites (MAc), abundance change from a previous age (agep) to agec, ∆age1 and ∆age2. For each frailty outcome, FI-union features identified were individually subjected to linear mixed models. b Coefficients of eight metabolites of which MAc presents significance in the association with both FIc and devFIc. Metabolites are arranged by coefficients (represented by dots) for FIc in descending order. The line represents the 95% confidence interval of each coefficient. c 27 metabolites of which the current metabolite abundance presents significance in the association with ∆FI. Metabolites are arranged by coefficients (represented by dots) in descending order. Significance was determined by adjusted p-values via Benjamini–Hochberg false discovery rate procedure at a cutoff of 0.05, with * for p < 0.05, ** for p < 0.01, and, *** for p < 0.001. d List of 23 metabolites that show occurrences greater than or equal to 2. That is, MA/∆MA of metabolite presents significance in the association with frailty outcomes of the column.
Fig. 6
Fig. 6. Sex independent metabolite features and association.
a UpSet plot showing the overlapping metabolites of frailty index union features of the whole cohort, females and males. b Coefficients of six metabolites of which metabolite change presents significance in the association with both FIc and devFIc in females. Metabolites are arranged by coefficients (represented by dots) for FIc in descending order. c Coefficients of 26 metabolites of which metabolite change presents significance in the association with devFI change in females. The significance was determined by adjusted p-values via Benjamini–Hochberg false discovery rate procedure at a cutoff of 0.05, with * for p < 0.05, ** for p < 0.01, and, *** for p < 0.001. Metabolites are arranged by coefficients (dots) in descending order. The line represents the 95% confidence interval of each coefficient.
Fig. 7
Fig. 7. Performance of metabolite frailty clock in the discovery and validation cohorts.
Frailty models were built via machine learning approaches, with frailty index scores as the dependent variable and three sets of variables as the independent variables: 1) The age+sex model, linear regression models using age and sex, trained in the discovery and validation cohorts respectively; 2) The RF (781 metabolites) model, a random forest model using all 781 metabolites detected in this study, age and sex; and 3) metabolite frailty clock model, a random forest model using 63 informativity-based metabolites, age and sex. The performance of models in the corresponding cohort/subcohort (Female, F and male, M) for (a) Discovery cohort, b Validation cohort, and (c) sex stratified Validation subcohort (Males, M; Females, F) are presented using R2 and Root-mean-square deviation (RMSE).

Update of

Similar articles

References

    1. Mitnitski, A., Howlett, S. E. & Rockwood, K. Heterogeneity of human aging and its assessment. J. Gerontol. A Biol. Sci. Med. Sci.72, 877–884 (2017). - PMC - PubMed
    1. Whitehead, J. C. et al. A clinical frailty index in aging mice: comparisons with frailty index data in humans. J. Gerontol. A Biol. Sci. Med. Sci.69, 621–632 (2014). - PMC - PubMed
    1. Graber, T. G., Ferguson-Stegall, L., Liu, H. & Thompson, L. V. Voluntary aerobic exercise reverses frailty in old mice. J. Gerontol. A Biol. Sci. Med. Sci.70, 1045–1058 (2015). - PMC - PubMed
    1. Mitnitski, A. B., Mogilner, A. J. & Rockwood, K. Accumulation of deficits as a proxy measure of aging. Sci.World J.1, 323–336 (2001). - PMC - PubMed
    1. Heinze-Milne, S. D., Banga, S. & Howlett, S. E. Frailty assessment in animal models. Gerontology65, 610–619 (2019). - PubMed

LinkOut - more resources