. 2025 May 23;9(1):152.
doi: 10.1038/s41698-025-00941-6.

Perfusion-based ex vivo culture of frozen ovarian cancer tissues with preserved tumor microenvironment

Affiliations

Perfusion-based ex vivo culture of frozen ovarian cancer tissues with preserved tumor microenvironment

Monica De Luise et al. NPJ Precis Oncol. .

Abstract

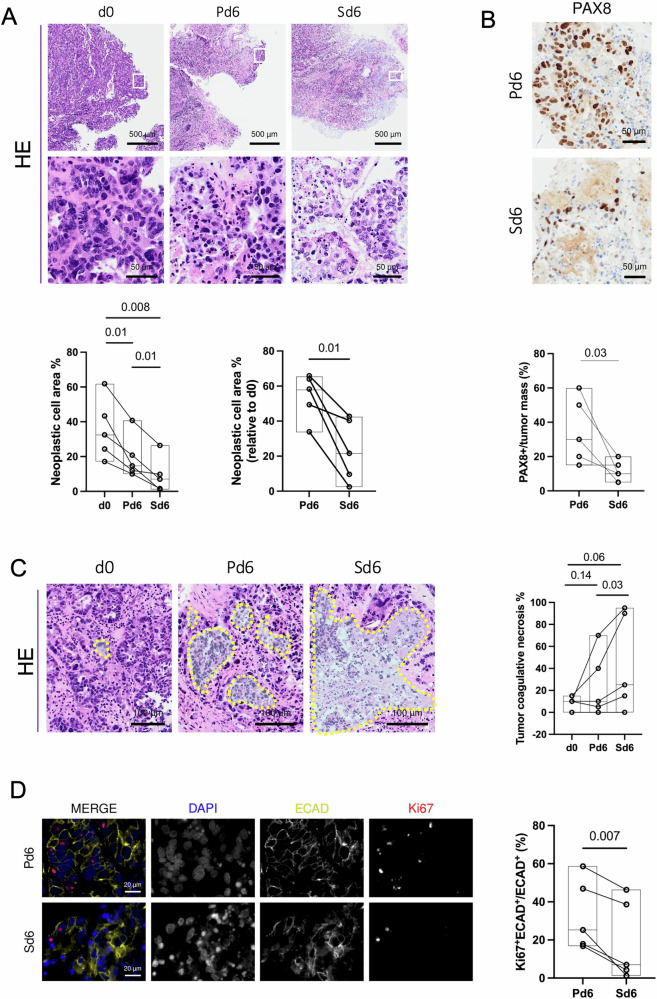
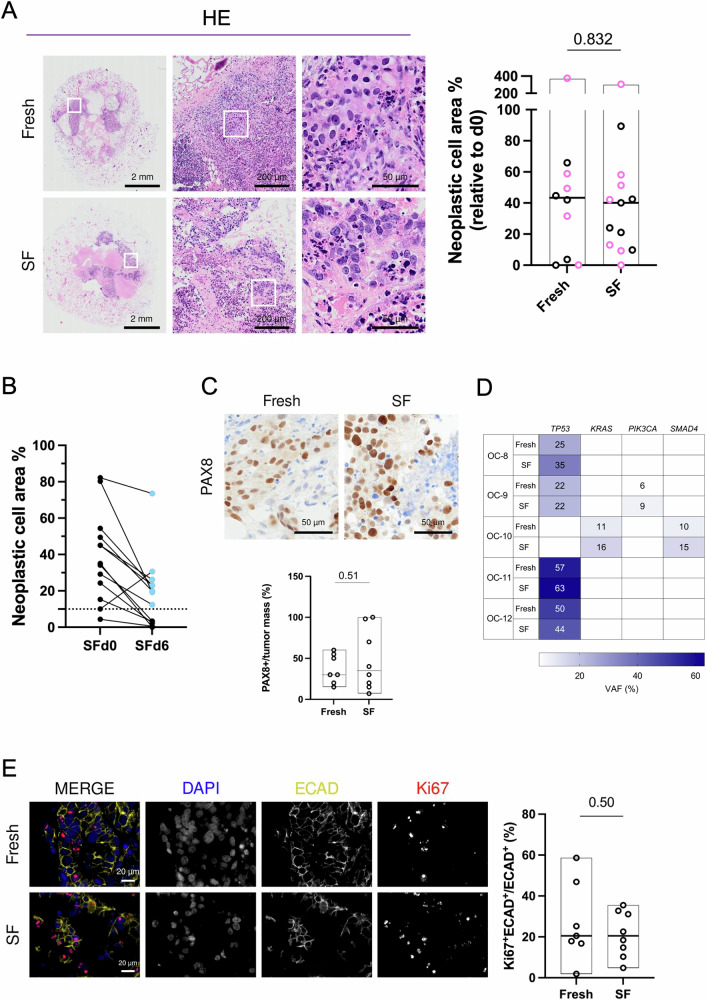
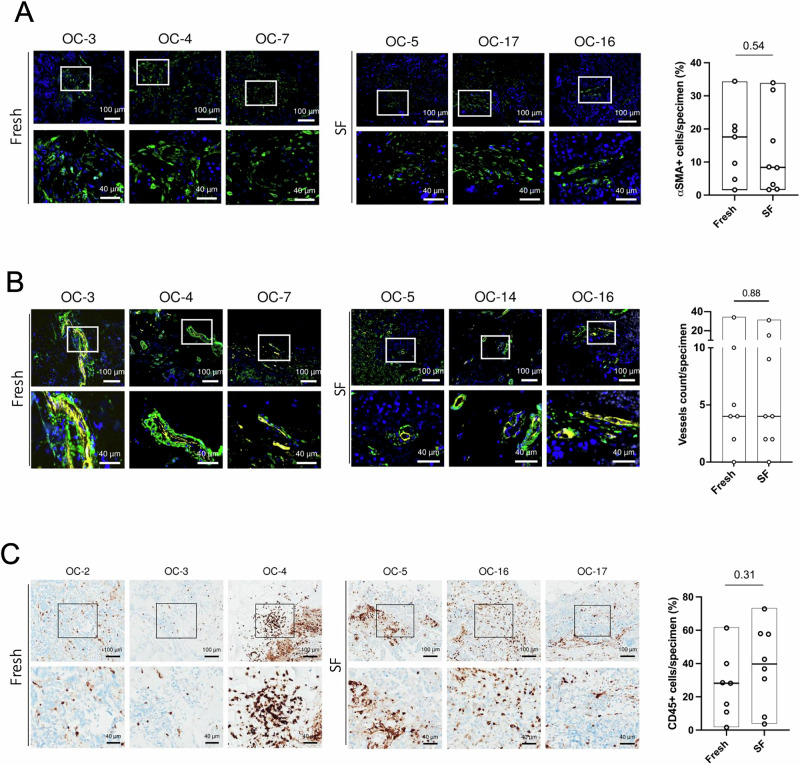
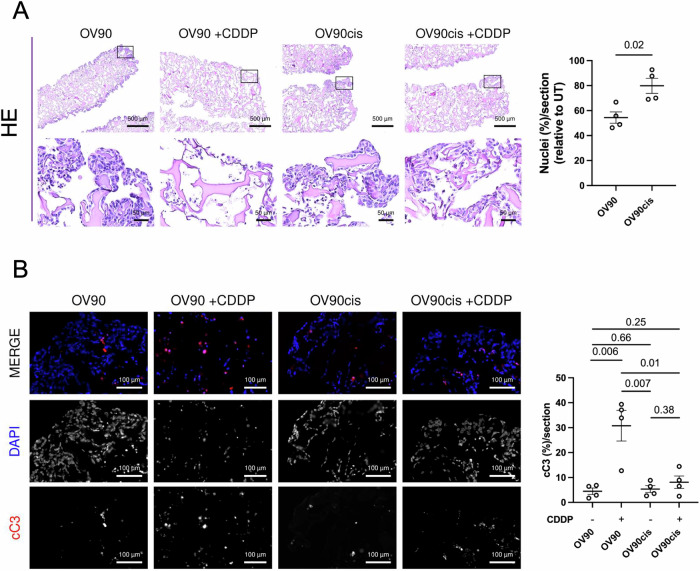
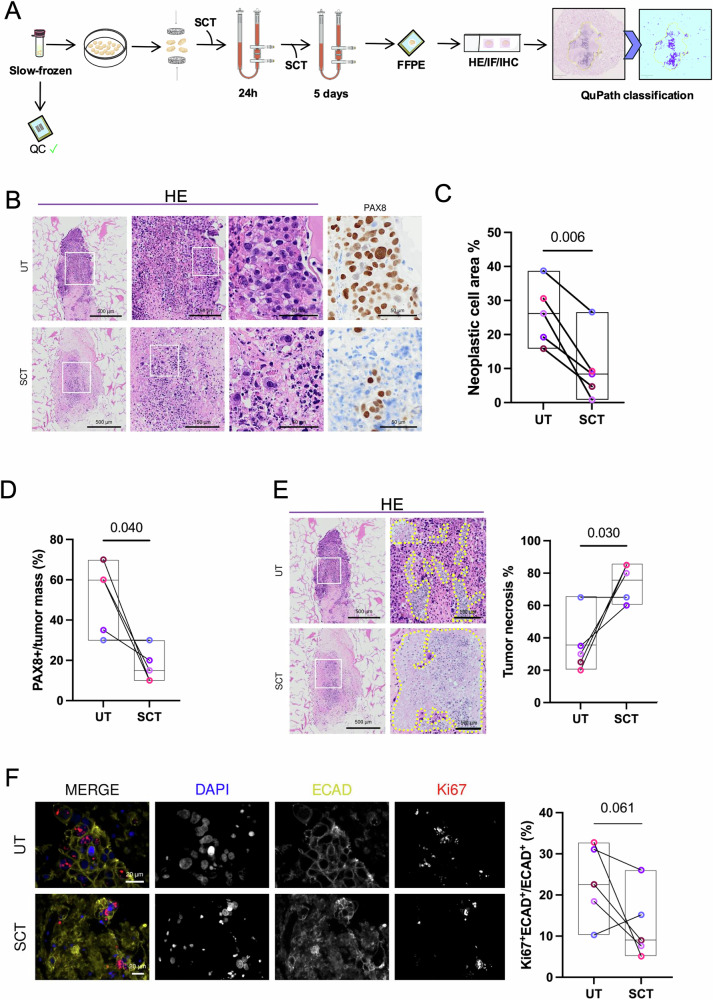
Ovarian cancer (OC) poses significant treatment challenges due to late-stage diagnosis and a complex tumor microenvironment contributing to therapy resistance. We optimized a U-CUP perfusion-based bioreactor method to culture patient-derived primary and metastatic OC specimens, demonstrating that perfusion better preserves cancer cell viability and proliferation, both when fresh and slow-frozen tissues were used. Perfused cultures maintained key microenvironment components, including cancer-associated fibroblasts, endothelial and immune cells. Genetic analysis confirmed the retention in culture of tumor-specific driver mutations. We hence challenged ad hoc generated cisplatin-sensitive and resistant OC cells with cisplatin during growth in U-CUP, validating our system for the testing of drug response. Finally, treatment of slow-frozen OC tissues with carboplatin/paclitaxel revealed different degrees of response to treatment, as indicated by variations in tumor necrosis and number of residual PAX8+ cells, providing the bases for the prompt evaluation of OC standard chemotherapy efficacy in our ex vivo system.


Conflict of interest statement

Competing interests: Ivan Martin is Cellec Biotek AG founder, shareholder, and member of the board. Manuele Giuseppe Muraro is Cellec Biotek AG scientific advisor and the inventor of the patent WO2015181185A1. All the other authors declare no competing interests.

Figures

Fig. 1
Fig. 1. Perfusion enhances ex vivo ovarian cancer (OC) tissue preservation and proliferation with respect to static culture.
A Representative images of haematoxylin and eosin (HE) staining of uncultured HGSC tissues and the LGSC OC-3 tissue (d0), and the corresponding 6-day culture in U-CUP perfused (Pd6) or static conditions (Sd6). White squares indicate the insets of the areas shown at higher magnification. Line plots represent the percentage of neoplastic cell area, quantified in each uncultured HGSC tissue and in the LGSC (OC-3) tissue (d0), paired to corresponding perfused (Pd6) and static (Sd6) 6-day cultures. The floating bar overlay indicates minimum to maximum, and the median value (black line) for each dataset. QuPath was used for quantification. Paired t-tests were applied for dataset comparison (n = 5). B Representative images of PAX8 immunohistochemistry in HGSC specimens and in the LGSC (OC-3) specimen cultured in perfused (Pd6) and static (Sd6) conditions. Line plot indicates the percentage of PAX8+ cells in the tumor mass quantified in paired tissues. The floating bar overlay indicates minimum to maximum, and the median value (black line) for each dataset. Quantification was performed by a trained pathologist. One-tailed paired t-test was applied for dataset comparison (n = 5). C Representative HE images of necrotic areas (dashed lines) in uncultured HGSC tissues and the LGSC (OC-3) tissue (d0) and the corresponding 6-day culture in U-CUP perfused (Pd6) or static (Sd6) conditions. Line plot indicates the percentage of necrosis in the tumor mass quantified in paired tissues. The floating bar overlay indicates minimum to maximum, and the median value (black line) for each dataset. Quantification was performed by a trained pathologist. The LGSC sample (OC-3) (flat line) is plotted for data transparency without being included in the statistical analysis due to the absence of tumor necrosis in these tumors. One-tailed paired t-tests were applied for dataset comparison of HGSC (n = 4). D Representative IF images of HGSC specimens and the LGSC (OC-3) specimen cultured in perfused (Pd6) and static (Sd6) conditions. Nuclei (DAPI, blue), epithelial cells (ECAD, dark yellow), and the proliferative marker Ki67 (Ki67, red) are shown in MERGE. The single fluorescence channels are shown separately in black/white images. Line plot represents the percentage of Ki67+ECAD+ cells normalized to all ECAD+ cells present in the neoplastic cell area. The floating bar overlay indicates minimum to maximum, and the median value (black line) for each dataset. QuPath was used for quantification. Paired t-test was applied for dataset comparison (n = 5). For all panels, p-values are shown within the graphs.
Fig. 2
Fig. 2. Cell viability and proliferation are preserved in perfused, slow-frozen ovarian cancer (OC) culture.
A Representative images of haematoxylin and eosin (HE) staining of perfused cultures derived from Fresh or Slow-Frozen (SF) tissues. White squares indicate the insets of the areas shown at higher magnification. The floating bar graph shows the neoplastic cell area percentage in perfused cultures derived from HGSC and the LGSC (OC-3) Fresh (n = 10) or HGSC SF (n = 13) specimens, with respect to the uncultured tissue (d0). Black and pink circles indicate primary tumors and metastases, respectively. Minimum, maximum, and median values (black line) are indicated for each dataset. QuPath was used for quantification. B Line plot represents the percentage of neoplastic cell area in SF HGSC chunks upon thawing (SFd0) and after 6-day culture in U-CUP (SFd6), with respect to the specimen’s area. The dotted line separates the samples with residual neoplastic cell area ≥10% (cyan dots) (n = 13). C Representative images of PAX8 immunohistochemistry in perfused cultures derived from Fresh or SF tissues. The floating bar graph shows the percentage of PAX8+ cells in the tumor mass. Minimum, maximum, and median values (black line) are indicated for each dataset (HGSC and the LGSC OC-3 Fresh n = 7, HGSC SF n = 8). Quantification was performed by a trained pathologist. D Variant allele frequency (VAF) percentage of TP53, KRAS, PIK3CA, and SMAD4 mutations in perfused cultures derived from HGSC Fresh or SF tissues. E Representative IF images of perfused cultures derived from Fresh or SF tissues. Nuclei (DAPI, blue), epithelial cells (ECAD, dark yellow), and the proliferative marker Ki67 (Ki67, red) are shown in MERGE. The single fluorescence channels are shown separately in black/white images. The floating bar graph represents the percentage of Ki67+ECAD+ cells normalized to all ECAD+ cells present in the neoplastic cell area (HGSC and the LGSC OC-3 Fresh n = 7, HGSC SF n = 8). Minimum to maximum, and the median values (black line) are shown for each dataset. QuPath was used for quantification. For all data presented in the floating bar graphs, unpaired t-tests were applied for comparison and p-values are shown within the graphs.
Fig. 3
Fig. 3. Tumor microenvironment components are preserved in perfused, slow-frozen ovarian cancer (OC) culture.
A Representative IF images of perfused cultures derived from Fresh HGSC and the LGSC (OC-3) tissues or SF HGSC tissues. Nuclei (blue) and a stromal marker αSMA (green) are shown. The floating bar graph shows the percentage of αSMA+ cells in the specimen. B Representative IF images of perfused cultures derived from Fresh HGSC and the LGSC (OC-3) tissues or SF HGSC tissues. Nuclei (blue), the pericyte marker αSMA (green), and the endothelial marker CD31 (yellow) are shown in MERGE. White squares indicate the insets of the areas shown at higher magnification. Floating bar graphs represent the number of αSMA+CD31+ vessels per specimen (vessel count) found in perfused cultures derived from Fresh or SF tissue. C Representative images of CD45 immunohistochemistry in perfused cultures derived from Fresh HGSC and the LGSC (OC-3) tissues or SF HGSC tissues. Black squares indicate the insets of the areas shown at higher magnification. The floating bar graph shows the percentage of CD45+ cells in the specimen. For all panels, 7 Fresh and 8 SF samples were used, and representative images of cultures derived from 3 different patients are shown. Floating bar graphs indicate minimum, maximum, and median values (black line) for each dataset. QuPath was used for quantification; unpaired t-tests were applied for comparison; and p-values are shown within the graphs.
Fig. 4
Fig. 4. Response to cisplatin can be efficiently assessed in ovarian cancer (OC) cells under perfusion.
A Representative images of haematoxylin and eosin (HE) staining of the U-CUP perfused sensitive (OV90) and resistant (OV90cis) OC cells treated with cisplatin (CDDP, 18 μM). Black squares indicate the insets of the areas shown at higher magnification. Scatter plot represents the nuclei percentage within the 4 µm section, normalized to the untreated control (UT). B Representative IF images of the U-CUP perfused sensitive (OV90) and resistant (OV90cis) cells treated with cisplatin (CDDP, 18 µM). Nuclei (DAPI, blue) and cleaved caspase 3 (cC3, red) are shown in MERGE. The single fluorescence channel is shown separately in black/white images. Scatter plot represents the percentage of cC3+ cells per 4 µm section. For all panels, data from two independent experiments (n = 2 biological replicates for each experiment) and the mean values ±SEM are shown. QuPath was used for quantification; unpaired t-tests were applied for comparison; and p-values are shown within the graphs.
Fig. 5
Fig. 5. Perfused ovarian cancer (OC) tissues derived from slow-frozen specimens respond to SCT.
A Schematic representation of the experimental setting. Slow-Frozen chunks derived from HGSC, presenting with ≥10% of neoplastic cell area after 6-day culture, were cultured in U-CUP, in the presence of a combination of carboplatin (70 μM) and paclitaxel (100 nM) mimicking a cycle of standard chemotherapy (SCT), or untreated (UT). After 24 h, all samples were replenished with fresh media without SCT, left in perfused culture for the subsequent 5 days and processed for downstream analyses. B Representative images of haematoxylin and eosin (HE) staining and PAX8 immunohistochemistry of UT and SCT-treated OC specimens cultured in U-CUP. C Line plot indicates the percentage of neoplastic cell area with respect to the area of the specimen in UT and SCT-treated OC samples. QuPath was used for quantification. D Line plot indicates the percentage of PAX8+ cells in the tumor mass for each specimen, in untreated (UT) and SCT-treated OC samples. Quantification was performed by a trained pathologist. E Representative HE images of necrotic areas (dashed lines) observed in UT and SCT-treated OC samples. Line plot indicates the percentage of necrosis in the tumor mass quantified in paired tissues by a trained pathologist. F Representative IF images of UT and SCT-treated HGSC samples. Nuclei (DAPI, blue), epithelial cells (ECAD, dark yellow), and the proliferative marker Ki67 (red) are shown in MERGE. The single fluorescence channels are shown separately in black/white images. Line plot represents the percentage of Ki67+ECAD+ cells normalized to all ECAD+ cells per specimen. QuPath was used for quantification. For all panels, color coding was used to track the cultures deriving from the same patient; floating bar overlay indicates minimum to maximum, and the median value (black line) for each dataset (n = 5), paired t-test was applied for comparison and p-values are indicated for statistical comparisons.

Similar articles

References

    1. Sung, H. et al. Global Cancer Statistics 2020: GLOBOCAN Estimates of Incidence and Mortality Worldwide for 36 Cancers in 185 Countries. CA Cancer J. Clin.71, 209–249 (2021). - PubMed
    1. Cancer of the Ovary - Cancer Stat Facts (2025). SEER. https://seer.cancer.gov/statfacts/html/ovary.html.
    1. Berek, J. S., Renz, M., Kehoe, S., Kumar, L. & Friedlander, M. Cancer of the ovary, fallopian tube, and peritoneum: 2021 update. Int J. Gynaecol. Obstet.155, 61–85 (2021). - PMC - PubMed
    1. Arora, T., Mullangi, S., Vadakekut, E. S. & Lekkala, M. R. Epithelial Ovarian Cancer. In StatPearls (StatPearls Publishing) (2024). - PubMed
    1. Torre, L. A. et al. Ovarian cancer statistics, 2018. CA Cancer J. Clin.68, 284–296 (2018). - PMC - PubMed

LinkOut - more resources