. 2025 Jul;4(7):801-820.
doi: 10.1038/s44161-025-00655-9. Epub 2025 May 23.

Angiopoietin-TIE2 feedforward circuit promotes PIK3CA-driven venous malformations

Affiliations

Angiopoietin-TIE2 feedforward circuit promotes PIK3CA-driven venous malformations

Marle Kraft et al. Nat Cardiovasc Res. 2025 Jul.

Abstract

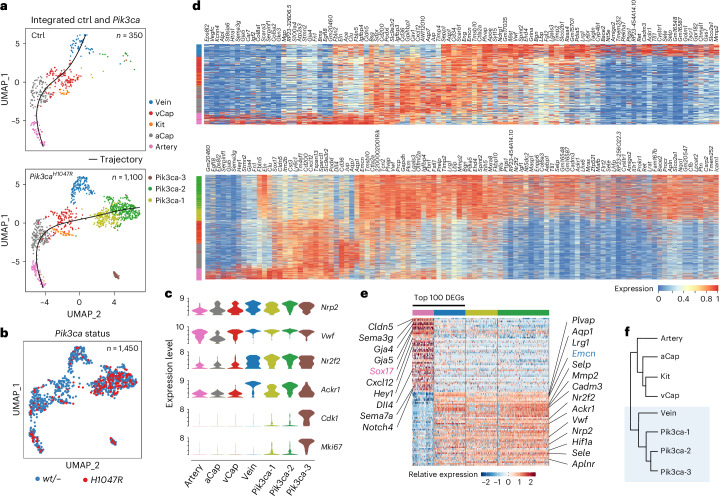
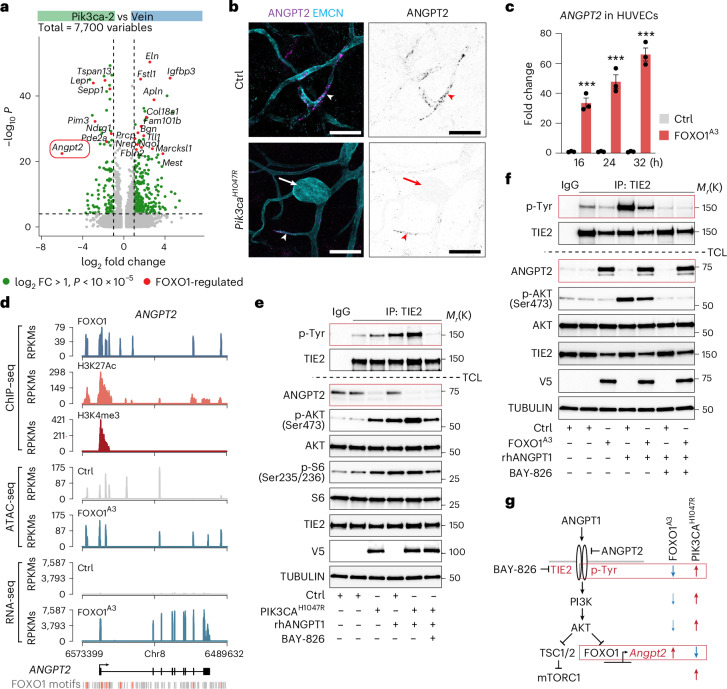
Venous malformations (VMs) are vascular anomalies lacking curative treatments, often caused by somatic PIK3CA mutations that hyperactivate the PI3Kα-AKT-mTOR signaling pathway. Here, we identify a venous-specific signaling circuit driving disease progression, where excessive PI3Kα activity amplifies upstream TIE2 receptor signaling through autocrine and paracrine mechanisms. In Pik3caH1047R-driven VM mouse models, single-cell transcriptomics and lineage tracking revealed clonal expansion of mutant endothelial cells with a post-capillary venous phenotype, characterized by suppression of the AKT-inhibited FOXO1 and its target genes, including the TIE2 antagonist ANGPT2. An imbalance in TIE2 ligands, likely exacerbated by aberrant recruitment of smooth muscle cells producing the agonist ANGPT1, increased TIE2 activity in both mouse and human VMs. While mTOR blockade had limited effects on advanced VMs in mice, inhibiting TIE2 or ANGPT effectively suppressed their growth. These findings uncover a PI3K-FOXO1-ANGPT-TIE2 circuit as a core driver of PIK3CA-related VMs and highlight TIE2 as a promising therapeutic target.


Conflict of interest statement

Competing interests: The authors declare no competing interests.

Figures

Fig. 1
Fig. 1. Formation of Pik3ca-driven cutaneous VMs in the absence of developmental angiogenesis and VEGF.
a, Genetic constructs for tamoxifen-inducible BEC-specific expression of Pik3caH1047R. b,c, Experimental scheme for Pik3ca-driven VMs in ear skin following 4-OHT induction at 3 weeks, 10 weeks (b) or 20 weeks (c) of age (50 μg, topical application to each ear) and analysis. Images show whole-mount immunofluorescence of ear skin with VM lesions (arrowheads) from 4-OHT-treated Pik3caH1047R;Vegfr1-CreERT2 mice at the indicated time points. d, Quantification of vessel growth 2 weeks and 6 weeks after 4-OHT induction. Data represent an increase in EMCN+ vessel area relative to Cre littermate control (Ctrl), mean ± s.d. (sample size at 3, 10 and 20 weeks: Ctrl: n = 3, 4 and 2 mice, respectively; 2 weeks after 4-OHT, n = 3, 2 and NA mice, respectively; 6 weeks after 4-OHT, n = 7, 4 and 7 mice, respectively). e, Experimental scheme (top) for the inhibition of VEGF signaling by intraperitoneal injection of AAV vectors encoding VEGF-Grab or a control molecule before induction of vessel overgrowth in the ear skin of Pik3caH1047R;Vegfr1-CreERT2 mice, visualized below by whole-mount immunofluorescence. f, Quantification of vessel growth, shown as a change in EMCN+ vessel area relative to Cre littermate Ctrl, mean ± s.d. (n = 2 (Ctrl + Ctrl-Trap), n = 2 (Pik3caH1047R+ Ctrl-Trap), n = 2 (Ctrl + VEGF-Grab), n = 3 (Pik3caH1047R + VEGF-Grab) mice). Scale bars, 100 μm (b, c and e). Source data
Fig. 2
Fig. 2. AV zonation and post-capillary venous characteristics of the dermal microvasculature.
a, Experimental scheme for Smart-Seq2 scRNA-seq analysis of dermal BECs from 5-week-old Pik3caH1047R; Cdh5-CreERT2 (n = 5) and Ctrl (n = 3) mice 2 weeks after topical application of 25 µg of 4-OHT to each ear. b, UMAP representation of 321 dermal BECs from Ctrl mice. Four BEC clusters after Harmony batch effect correction are annotated and schematically matched to their anatomic position within the vascular bed on the right (color coded according to UMAP). c, Dot plot of markers defining the four subclusters of BECs from b. Exemplary arterial (Sox17) and venous (Emcn) markers are highlighted. d, Whole-mount immunofluorescence of ear skin showing EMCN and SOX17 expression across the AV axis in a Ctrl mouse. Antibody against αSMA was used to visualize SMC coverage in arteries. Arrowheads are color coded according to UMAP in b, indicating vessel type. Similar results were obtained from two mice. Scale bar, 200 µm. e, GO enrichment analysis applying GOstats to the top vein and artery cluster markers using a standard hypergeometric test with a significance threshold of P < 0.00001). P values of GO terms are encoded by color gradient; NA indicates no enrichment. Groups of cluster-specific terms are color coded accordingly. f, UMAP representation and annotation of 36,590 dermal BECs from 23 healthy human individuals after Seurat’s anchor-based integration. g, Dot plot of relative marker expression defining the six subclusters of BECs from f. Dot sizes in c and g represent transcript percentage in each cluster. Color illustrates the average expression compared across displayed clusters. FACS, fluorescence-activated cell sorting. NA, not applicable. Panel a created with BioRender.com. Source data
Fig. 3
Fig. 3. Venous identity of Pik3caH1047R -expressing BECs.
a, Split UMAP representation of 1,450 single-cell transcriptomes of Harmony-integrated dermal BECs from Ctrl (350 cells, top) and Pik3caH1047R;Cdh5-CreERT2 mice (1,100 cells, below) with color-coded cluster identities. Black lines show trajectories obtained by unsupervised trajectory interference analysis using Slingshot, visualized in UMAP space. b, Pik3ca transcript status visualized in combined UMAP clustering. c, Violin plots showing gene expression of selected venous and proliferation marker genes distributed across venous and disease-specific clusters. d, Heat maps of zonation marker expression across cells, ordered by cluster and along their trajectory, according to the respective UMAP representations for each genotype shown in a. Color indicates read counts on a log scale. e, Gene expression of the top 100 DEGs between artery and vein clusters in disease-specific clusters. Selected arterial (left) and venous (right) identity markers are highlighted. f, Cluster positions on a phylogenetic tree constructed in principal component analysis space using Seurat. The close relation of venous and disease-specific clusters is highlighted in blue. Source data
Fig. 4
Fig. 4. Pik3ca-driven VM is defined by clonal expansion of BECs with a post-capillary venous phenotype.
a, Heat maps showing relative gene expression of selected top DEGs between vCap and vein clusters in non-proliferative disease-specific clusters. Color coding represents average relative expression across different clusters. b, Top, Average gene expression profile of exemplary arterial (Sox17, red) and venous (Lrg1, blue) markers in Ctrl or Pik3ca clusters. Below, Gene expression of Sox17 and Lrg1 in single cells, ordered along the Ctrl or Pik3ca trajectory shown in Fig. 3a. c, Bar graph of relative cell-type proportions split by genotype based on integrated BECs from Pik3caH1047R;Cdh5-CreERT2 and Ctrl mice. d, Immunofluorescence of ear skin from a 4-OHT-treated 5-week-old Pik3caH1047R;Vegfr1-CreERT2 mouse, showing vascular overgrowth in SOX17+EMCNlow capillaries (light-green arrowhead) and SOX17EMCN+ veins (dark-green arrowhead). Phenotypically normal vessel types, annotated based on their morphology and marker expression, are highlighted by arrowheads as indicated. Similar results were obtained from two mice. e, Genetic construct for tamoxifen-inducible expression of a clonal iChr2-Control-Mosaic reporter in Pik3caH1047R;Vegfr1-CreERT2 mice. Recombination occurs between arrowheads of the same color (LoxP site), resulting in the expression of one of three possible nuclear-localized fluorescent proteins. f, Whole-mount immunofluorescence of ear skin from 6-week-old Pik3caH1047R;R26-iChr2-Mosaic;Vegfr1-CreERT2 mice with BECs expressing EGFP or mCherry. 4-OHT treatment (20 µg topically on the ear) was done at 3 weeks of age. Higher magnifications show representative EMCNhigh veins of different calibers, and EMCNlow venous capillaries. Similar results were obtained from >5 mice in three independent experiments. g, Scheme for longitudinal intravital imaging of lesion growth in Pik3caH1047R;R26-iChr2-Mosaic;Vegfr1-CreERT2 mice. h, Representative intravital microscopy images of the dermal microvasculature and BECs expressing EGFP or mCherry (on days 0, 3, 6 and 9), with nuclei counts indicated. PECAM1 antibody injection was used to visualize the vasculature. At the end of the experiment (day 12), the same lesions were imaged following whole-mount staining using confocal microscopy. i, Quantification of clonal expansion, showing the number of nuclei counted at five time points within the same lesions. Scale bars, 200 μm (d), 500 µm (f, overview), 100 μm (f, magnifications) and 50 μm (h, magnification). 2P, two-photon. Panel e adapted from ref. under a Creative Commons license CC BY 4.0. Panel g created with BioRender.com. Source data
Fig. 5
Fig. 5. Loss of FOXO1-induced ANGPT2 expression and increase in TIE2 activity in Pik3caH1047R-expressing BECs.
a, Volcano plot of 7,700 DEGs between Pik3ca-2 and vein clusters. Negative log2 fold changes (x axis) represent downregulated gene expression, while positive log2 fold changes represent upregulated gene expression in the mutant. Differential gene expression was assessed using Seurat’s Wilcoxon rank-sum test. Significant upregulated and downregulated genes are marked in green (P value < 0.00001, log2FC ≥ 1; y axis) and those shared with FOXO1A3 downregulated genes (from c) are highlighted in red. b, Whole-mount immunofluorescence of mouse ear skin showing ANGPT2 in EMCN+ venous vessels (arrowheads), but not in vascular lesions in the Pik3caH1047R mutant mouse (arrow). Single-channel images for ANGPT2 staining are shown on the right. Similar results were obtained from three mice in two independent experiments. c, ANGPT2 transcript levels in HUVECs transduced with AKT-resistant FOXO1A3 and Ctrl, analyzed by RNA-seq at different time points. Data points represent individual biological replicates of ANGPT2 mRNA expression levels (in fold change), mean ± s.d. (n = 3 (Ctrl) and n = 3 (FOXO1A3) at each time point). ***P < 0.001, unpaired two-tailed Student’s t-test: P(16 h) = 0.0006, P(24 h) = 0.0005, P(32 h) = 0.0001. d, ChIP–seq, ATAC-seq and RNA-seq signals at the ANGPT2 genomic locus performed in FOXO1A3-expressing HUVECs. FOXO consensus motifs bound by FOXO1 are indicated in orange. Unbound FOXO motifs are shown in gray. Sequencing signals are represented as reads per kilobase million (RPKMs). e,f, Immunoblot analysis of immunoprecipitated TIE2 (top) or total cell lysates (TCL; below) from Ctrl HUVECs and HUVECs expressing PIK3CAH1047R (e) or FOXO1A3 (f) using the indicated antibodies. AKT, S6, TIE2 and tubulin TCL western blots were used as sample loading controls. Cells were starved of serum and left untreated, or stimulated with ANGPT1 (50 ng ml-1 (e) or 200 ng ml-1 (f)), in the presence or absence of the TIE2 inhibitor BAY-826. Mr(K) indicates protein molecular weight marker (in kDa). IgG isotype control was used as a negative control. Data are representative of two independent experiments. g, Illustration of the TIE2–PI3K–FOXO pathways (left) and effects of FOXO1 (via FOXO1A3 expression, middle) and PI3K activation (via PIK3CAH1047R expression, right) on their pathway effectors. Blue indicates reduced activity; red indicates increased activity. Scale bars, 50 μm (a). Source data
Fig. 6
Fig. 6. Increased TIE2 phosphorylation and SMC coverage in Pik3ca-driven VM in mice.
a, PLA staining of activated TIE2 on ear skin paraffin sections from Pik3caH1047R;Vegfr1-CreERT2 and Cre littermate Ctrl mice, detected using pTyr and TIE2 antibodies. DAPI marks cell nuclei. b, Quantification of PLA signals within PECAM1+ blood vessels. Data represent the number of PLA dots per μm2 of PECAM1+ vessel area, mean ± s.d. (n = 8 (Ctrl) and n = 26 (Pik3caH1047R) vessels from four mice per genotype, unpaired two-tailed Student’s t-test, ****P = 0.0000054). c, Immunofluorescence of ear skin paraffin sections from Pik3caH1047R;Vegfr1-CreERT2 and Cre littermate Ctrl mice using phospho-TIE2 antibodies. d, Phospho-TIE2 signal within EMCN+ vessels, represented as corrected total cell fluorescence (CTFC) of EMCN+ vessel area. Data points represent pTIE2 CTFC, mean ± s.d. (n = 20 (Ctrl) and n = 31 (Pik3caH1047R) vessels from two mice per genotype, unpaired two-tailed Student’s t-test, ****P = 0.000096; Extended Data Fig. 8d). e, Whole-mount immunofluorescence of ear skin from Pik3caH1047R;Vegfr1-CreERT2 and Cre littermate Ctrl mice using αSMA antibodies 6 weeks after 4-OHT induction. f, Quantification of SMC coverage of veins and capillaries, shown as average percentage of EMCN+ area, mean ± s.d. (n = 4 (Ctrl) and n = 8 (Pik3caH1047R) mice, unpaired two-tailed Student’s t-test, P(vein) = 0.173 (NS, not significant) and ****P(capillary) = 0.0000078). g, Whole-mount immunofluorescence of ANGPT1+ cells associated with veins and capillaries one week after 4-OHT induction. Proliferating cells (arrowheads) were labeled in mutant mice with EdU 16 h before analysis. Asterisks indicate vessel-detached ANGPT1+ cells. h,i, Violin plots showing gene expression of Angpt1 and selected marker genes of EC–SMC interaction (h) and heat map showing relative importance of two selected ligand–receptor pairs, generated using CellChat (i), in Ctrl and Pik3ca EC clusters from Fig. 3a as well as in SMCs from the same dataset. Scale bars, 50 μm (a and g), 20 μm (c) and 100 μm (e). Source data
Fig. 7
Fig. 7. Increased TIE2 phosphorylation in human PIK3CA-driven VMs.
a, H&E-stained paraffin sections of cutaneous VMs from individuals with PIK3CA (top) or TEK (below) mutations. Areas defined as non-lesional (NL) and VM lesions are indicated. b, PLA staining of activated TIE2, detected using pTyr and TIE2 antibodies, in representative vessels from indicated NL and VM regions. DAPI marks cell nuclei. c, Quantification of PLA signals within PECAM1+ veins, represented as mean PLA dots per EC nucleus ± s.d. (n = 7 (PIK3CA), n = 6 (TEK), n = 2 (Ctrl) and n = 5 (NL) individuals, with symbols indicating different mutations; ordinary one-way analysis of variance (ANOVA) and Tukey’s multiple-comparison test, **P(PIK3CA VM versus Ctrl vein) = 0.0027 and **P(TEK VM versus Ctrl vein) = 0.0078; Extended Data Fig. 7). d, Representative immunofluorescence image (left) and quantification (right) showing the proportion of SMC coverage in vessels from VM and NL regions, categorized into three groups: multilayered (>two rows of αSMA-associated nuclei; red), single-layered (1–2 rows of αSMA-associated nuclei; blue) and discontinuous (lack of SMC coverage; gray). Arrowheads indicate examples of each category. DAPI marks cell nuclei; αSMA marks SMCs. e, Quantification of the SMC layer thickness in PIK3CA and TEK individuals, presented as the mean ± s.d. (PIK3CA individuals P1 (n = 11) and P2 (n = 4 vessels); TEK individuals T1 (n = 3), T2 (n = 3) and T3 (n = 8 vessels); NL regions P1 (n = 4), P2 (n = 4), T1 (n = 5) and T3 (n = 3 vessels)). Ordinary one-way ANOVA and Tukey’s multiple-comparison test, ****P(PIK3CA VM versus NL vein) = 0.0000071 and **P(TEK VM versus NL vein) = 0.003. Scale bars, 50 μm (b and d). Source data
Fig. 8
Fig. 8. Inhibition of the upstream TIE2 receptor signaling limits Pik3caH1047R -driven VM growth.
a, Experimental scheme for therapeutic treatment of advanced Pik3ca-driven VM with the TIE2 inhibitor BAY-826 (50 mg per kg body weight by oral gavage) and/or rapamycin (rapa, 10 mg per kg body weight by intraperitoneal (i.p.) injection). b, Whole-mount immunofluorescence of ear skin from Pik3caH1047R;Vegfr1-CreERT2 mice with advanced VMs after a 2-week treatment period. c,d, Quantification of the treatment outcome. Bar plots show the increase in EMCN+ vessel area relative to Cre littermate Ctrl mice, mean ± s.d. (n = 5 (vehicle), n = 5 (BAY-826), n = 4 (rapa), n = 7 (BAY-826 + rapa) mice; c); or increase in vessel diameter relative to Cre littermate controls, mean ± s.d. (n = 5 (vehicle), n = 5 (BAY-826), n = 4 (rapa), n = 4 (BAY-826 + rapa) mice (d). e, Experimental scheme for the induction of VMs and inhibition of TIE2 signaling by intraperitoneal injection of AAV vectors encoding a ligand-neutralizing soluble TIE2 extracellular domain (TIE2-ECD). fh, Whole-mount immunofluorescence of ear skin from Pik3caH1047R;Vegfr1-CreERT2 mice (f) and quantification of the treatment outcome (g and h). Bar plots show the increase in EMCN+ vessel area relative to Cre littermate Ctrl mice, mean ± s.d. (n = 14 (untreated), n = 8 (TIE2-ECD), n = 4 (rapa), n = 7 (TIE2-ECD + rapa) mice; g); or increase in vessel diameter relative to Cre littermate Ctrl mice, mean ± s.d. (n = 18 (Ctrl); Cre+ cohorts: n = 14 (untreated), n = 8 (TIE2-ECD), n = 4 (rapa), n = 7 (TIE2-ECD + rapa) mice (h). i, Scheme for assessing BAY-826 treatment response in Pik3caH1047R;R26-iChr2-Mosaic;Vegfr1-CreERT2 mice. j, Top, Intravital two-photon (2P) microscopy images of the dermal microvasculature stained using intravenous PECAM1 antibody injection, showing clonal lesions expressing EGFP or mCherry, at the start of treatment period. Below, Confocal images of the same lesions after a 2-week treatment period. Boxed regions are magnified on the right. k, Quantification of clonal expansion showing pretreatment and post-treatment nuclei counts (n = 42 lesions from six Ctrl mice and n = 24 lesions from three BAY-836-treated mice). In c, d, g, h and k, *P < 0.05, **P < 0.01, ****P < 0.0001, ordinary one-way ANOVA and Tukey’s multiple-comparison test (c, d, g and h) and paired two-tailed Student’s t-test (k). Scale bars, 100 μm (b and j, magnification) and 500 μm (b, f and j, overview). Source data
Extended Data Fig. 1
Extended Data Fig. 1. Characterization of Pik3ca-driven VM-formation across tissues and their dependency on VEGF.
(a) Top: Bright field images of ears from 4-OHT-treated Pik3caH1047R;Vegfr1-CreERT2 mice and Cre- littermate control mice (Ctrl) four weeks post-induction, showing macroscopic VM lesions and redness of ears skin in the mutant. Below: Whole-mount immunofluorescence showing overgrowth of EMCN+ veins but unaffected PDPN+ lymphatic vessels in the mutant. Similar results were obtained from 7 mice in 2 independent experiments. (b) Female reproductive tract (FRT) following topical application of 4-OHT (50 μg) to the ear skin of 3-week-old Pik3caH1047R;Vegfr1-CreERT2 mice and Cre- littermate control mice (Ctrl), showing vascular lesions in ovaries, fallopian tube and the uterine horn in the mutant. Boxed regions are magnified below. Similar results were obtained from 10 mice in 6 independent experiments. (c) Immunofluorescence (top) and Hematoxylin and Eosin staining (H&E) (below) of cryo-sections visualizing ECs (PECAM1) and SMCs (αSMA) in the uterus of Pik3caH1047R;Vegfr1-CreERT2 and Cre- littermate control mice (Ctrl). Arrowheads point to enlarged, SMC-covered vasculature in endometrial stroma (e). The boxed regions in both the H&E and immunofluorescence images correspond to the same areas, which are magnified on the right. m, myometrium. Similar results were obtained from 4 mice in 2 independent experiments. (d) Thyroid vasculature four weeks after intraperitoneal injection of AAV vectors encoding VEGF-Grab or a control molecule, and three weeks post-4-OHT induction. EMCN+ veins and αSMA+ SMCs are visualized. Similar results were obtained from 3 mice in 1 experiment. (e) Top: Experimental scheme for the induction of VMs followed by intraperitoneal injection of AAV vectors encoding VEGF-Grab or a control molecule to inhibit VEGF signaling. Below: Whole-mount immunofluorescence images of ear skin from VEGF-Grab or control-Trap-treated Pik3caH1047R;Cdh5-CreERT2 mice. Right: Quantification of vessel growth, represented as a change in EMCN+ vessel area relative to Cre- littermate control (Ctrl), mean ± sd (n = 4 (Ctrl+Ctrl-Trap), n = 7 (Pik3caH1047R+Ctrl-Trap), n = 6 (Ctrl+VEGF-Grab), n = 7 (Pik3caH1047R + VEGF-Grab) mice) from three independent experiments, indicated by symbol. ns, P = 0.8562 (not significant, ns), Unpaired two-tailed Student’s t-test. Scale bars: 1 cm (a, overview), 1 mm (a, b magnification), 500 μm (c, low magnification), 200 μm (d, c high magnification). Source data
Extended Data Fig. 2
Extended Data Fig. 2. Trajectory and cross-species conservation analysis of dermal BECs.
(a) Unsupervised trajectory inference analysis of dermal BECs from control mice using SCORPIUS, visualized in a UMAP plot. Black line indicates the trajectory. (b) Heatmap of zonation marker expression across cells ordered by cluster and along their trajectory, according to UMAP representation in a. (c) Dot plot of top genes characterizing KIT cluster in human BECs. (d) UMAP-embedded representation of Kit expression levels in control mouse BECs. (e) Dot plot of top genes characterizing Kit cluster in integrated control and Pik3ca mouse BECs. Dot size in c and d represents transcript percentage in each cluster, color illustrates the average expression compared across displayed clusters. (f) Venn diagram representation of conservation analysis of gene expression between mouse and human BEC clusters, based on the UMAP representations in Fig. 2b, f. (g) UMAP-embedded representation of BMX expression levels in human BECs, marking larger vessels at the terminal ends of arterial and venous clusters. (h) Violine plots of immune-associated post-capillary venule markers, and capillary marker SOX17, in human BECs, according to UMAP representation in Fig. 2f. Source data
Extended Data Fig. 3
Extended Data Fig. 3. Characterization of Pik3ca mutant-specific BEC clusters.
(a) Unsupervised trajectory inference analysis of dermal BECs from control and Pik3ca mutant mice using SLINGSHOT, visualized in a UMAP plot. (b) Proportion of BECs from control and Pik3ca mutant mice expressing either the endogenous mouse Pik3ca transcript (wt) and/or the transgenic Pik3caH1047R transcript (H1047R). (c) Volcano plots showing results from DEG analysis between Pik3caH1047R transcript-positive and -negative BECs from the mutant mice within Pik3ca-1 and Pik3ca-2 clusters. Negative log2 fold changes (FC) represent upregulated gene expression in Pik3caH1047R transcript-negative BECs (wt /-), while positive log2 FC represent upregulated gene expression in transcript-positive BECs. Significance of differential gene expression was assessed using Seurat’s Wilcoxon rank-sum test. Note only a few genes significantly upregulated in the transcript-positive BECs, marked in red (P-value < 0.00001, log2FC ≥ 1). (d) ICAM1 expression in EMCN+ venous ECs in whole-mount ear skin from 4-OHT-treated Pik3caH1047R;Vegfr1-CreERT2 and Cre- littermate control mice (Ctrl). αSMA is used to label SMCs. Arrows indicate larger veins; arrowheads point to venous capillaries. Similar results were obtained from 3 mice in 1 experiment. (e) UMAP representation of Angpt2 transcript levels in BECs from control and Pik3ca mutant mouse. Scale bars: 50 μm. Source data
Extended Data Fig. 4
Extended Data Fig. 4. FOXO1-dependent and independent transcriptomes of Pik3caH1047R.
(a) Predicted transcription factors using TFactS based on up and down regulated DEGs (P < 0.00001, log2FC ≥ 1) of Pik3ca-1 and Pik3ca-2 compared to vCap and Vein clusters, respectively. Statistical significance is presented as e-value scores, red line represents intersection percentage between up- and downregulated genes for each transcription factor. Results were grouped by predicted activation or inactivation of transcription factors. Direct AKT substrates are indicated in blue, asterisks indicate GSK3β substrates. (b) GOstats enrichment analysis of top cluster markers (P < 0.00001, log2FC ≥ 1) of mutant-specific clusters Pik3ca-1 and Pik3ca-2. Top displayed GO terms are ordered by Odds Ratio, dot size represents gene count/GO term, P-values are encoded by colour gradient. (c) Venn diagrams showing shared and unique genes of DEGs significantly up- or downregulated (P < 0.00001) in HUVECs expressing AKT-resistant FOXO1A3 mutant compared to control HUVECs, and in mutant-specific BECs cluster Pik3ca-1 or Pik3ca-2 compared to vCap or Vein clusters. (d) GO enrichment analysis (GOstats) of upregulated DEGs unique for Pik3ca-1 or Pik3ca-2, and those shared with FOXO1 signature, as displayed in c. Terms associated with immune cell trafficking are indicated in bold. P-values of GO terms are encoded by colour gradient (n/a indicates no enrichment). Source data
Extended Data Fig. 5
Extended Data Fig. 5. Technical controls for PLA.
PLA analysis using either a phospho-Tyrosine (pTyr) or TIE2 antibody alone, showing the absence of signal (green) in mouse (a) and human (b) skin. PECAM1 and DAPI were used to mark blood endothelial cells and cell nuclei, respectively. αSMA marks smooth muscle cells. Scale bars: 50 μm (a, b).
Extended Data Fig. 6
Extended Data Fig. 6. ANGPT1 expression in human and mouse tissues.
(a) Organ-wide average gene expression (normalized transcripts per million, nTPM), of ANGPT1 in different cell types, extracted from Human Protein Atlas scRNA-seq data. ANGPT1 expression in SMCs is highlighted in red and in BECs in blue. (b) Gene expression of ANGPT1 and selected mural cell markers in different skin cell types extracted from Human Protein Atlas scRNA-seq data. (c) Whole mount immunofluorescence of ANGPT1+ SMCs (αSMA) associated with veins (arrows) but not arteries (arrowhead) in the ear skin of a control mouse. Similar results were obtained from 3 mice in 2 independent experiments. Scale bars: 50 μm.
Extended Data Fig. 7
Extended Data Fig. 7. TIE2 phosphorylation in human VM.
(a) Quantification of PLA signals of activated TIE2, detected using pTyr and TIE2 antibodies, within PECAM1+ veins from individual patients and healthy individuals (Ctrl) from two different cohorts, denoted by patient ID (see Supplementary Table 1 for details). Data represent number of PLA dots per nucleus of individual vessels, mean ± sd (PIK3CA patients P1 (n = 17), P2 (n = 21), P3 (n = 9), P4 (n = 6), P5 (n = 6), P6 (n = 5), P7 (n = 6) vessels; TEK patients T1 (n = 8), T2 (n = 14), and T3 (n = 14), T4 (n = 8), T5 (n = 7), T6 (n = 4) vessels; Healthy individuals C1 (n = 5), C2 (n = 6) vessels; NL regions P1 (n = 12), P2 (n = 4), T1 (n = 15), and T3 (n = 15) vessels). Barplots outlined in red indicate patients shown in Fig. 7a, b. ***P < 0.001, ****P < 0.0001, unpaired two-tailed Student’s t-test; Exact P values are provided in Source Data. (b-d) Hematoxylin and Eosin (H&E)-stained paraffin sections of cutaneous VMs from patients with PIK3CA (b) or TEK mutations (c), or of control skin (d) including non-lesional (NL) area and normal skin as indicated. PLA staining of activated TIE2, detected using pTyr and TIE2 antibodies, in representative vessels are shown on the right. DAPI marks cell nuclei. Scale bars: 50 μm (b-d). Source data
Extended Data Fig. 8
Extended Data Fig. 8. Effects of BAY-826/rapamycin on Pik3ca-driven VM lesions.
(a) Experimental scheme for preventive treatment of Pik3ca-driven VM with BAY-826 (50 mg/kg by oral gavage) and in combination with rapamycin (rapa, 10 mg/kg by intraperitoneal injection, i.p.). (b) Whole-mount immunofluorescence of ear skin from Pik3caH1047R;Vegfr1-CreERT2 mice at treatment start (one week after 4-OHT induction), and after a three-week treatment period. (c) Treatment effect on vessel growth, shown as increase in EMCN+ vessel area relative to Cre- littermate control, mean ± sd (n = 5 (Vehicle), n = 4 (BAY-826), n = 3 (BAY-826+rapa) mice), ordinary one-way ANOVA and Tukey’s multiple comparison P(Vehicle vs. BAY-826) = 0.000065 and P(Vehicle vs. BAY-826 + rapa)= 0.0029. (d) Phospho-TIE2 signal within EMCN+ vessels in Pik3caH1047R;Vegfr1-CreERT2 and Cre- littermate control mice (Ctrl) after BAY-826 and/or rapamycin treatment, following the scheme in Fig. 8a, represented as corrected total cell fluorescence (CTFC) of EMCN+ vessel area, mean ± sd (n = 20 (Ctrl); Cre+ cohorts: n = 31 (Vehicle), n = 31 (BAY-826), n = 12 (rapa), n = 15 (BAY-826+rapa) vessels from 2 mice per group). (e) SMC coverage in ear skin of Pik3caH1047R;Vegfr1-CreERT2 and Cre- littermate control mice, shown as average % of EMCN+ area ± sd of veins and capillaries (n = 9 (Ctrl); Cre+ cohorts: n = 4 (Vehicle), n = 5 (BAY-826), n = 4 (rapa), n = 3 (BAY-826+rapa) mice). (f) Lesion numbers in the ear skin of Pik3caH1047R;Vegfr1-CreERT2 mice, mean ± sd (n = 5 (Vehicle), n = 5 (BAY-826), n = 4 (rapa), n = 4 (BAY-826+rapa) mice). (g) SMC coverage in the ear skin of Pik3caH1047R;Vegfr1-CreERT2 and Cre- littermate control mice (Ctrl), shown as average % of EMCN+ area ± sd of veins (n = 8 (Ctrl); Cre+ cohorts: n = 9 (untreated), n = 4 (TIE2-ECD), n = 4 (rapa), n = 7 (TIE2-ECD+rapa) mice) and capillaries (n = 15 (Ctrl); Cre+ cohorts: n = 13 (untreated), n = 6 (TIE2-ECD), n = 4 (rapa), n = 7 (TIE2-ECD+rapa) mice). (h) Lesion numbers in the ear skin of Pik3caH1047R;Vegfr1-CreERT2 mice, mean ± sd (n = 14 (untreated), n = 8 (TIE2-ECD), n = 4 (rapa), n = 7 (TIE2-ECD+rapa) mice); Differences in absolute levels of % SMC coverage in e and g is due to differences in image acquisition parameters. *P < 0.05, **P < 0.01, ****P < 0.0001, ns, P > 0.05, Ordinary one-way ANOVA and Tukey’s multiple comparison. Exact P values are provided in Source Data. Scale bars: 500 μm (b). Source data
Extended Data Fig. 9
Extended Data Fig. 9. Effects of treatment on early lesions and control mice.
(a) Outcome of rapamycin treatment during early lesion formation in Pik3caH1047R;Vegfr1-CreERT2 mice (4-OHT induction at 3 weeks, treatment start at 4 weeks for 5 consecutive days, analysis at 5 weeks). Data represent increase in EMCN+ vessel area relative to Cre- littermate control, mean ± sd (n = 4 (Vehicle), n = 5 (rapa) mice), P = 0.0302 (*), unpaired two-tailed Student’s t-test. (b, c) Representative whole-mount immunofluorescence images of dermal vasculature of ear skin (b) and quantification (c) of the effect of TIE2 inhibitor BAY-826 and/or rapamycin treatment on Cre- littermate control mice. Treatment scheme is as in Fig. 8a (4-OHT induction at 3 weeks, treatment start at 6 weeks, analysis at 8 weeks). Data in (c) represent increase in EMCN+ vessel area relative to Vehicle control, mean ± sd (n = 3 (Vehicle), n = 4 (rapa), n = 3 (BAY-826), n = 6 (BAY-826+rapa) mice). (d) Treatment outcome in Pik3caH1047R;Vegfr1-CreERT2 mice by sex. Data shown in Fig. 8c is split by sex and represent increase in EMCN+ vessel area relative to Cre- littermate control mice of the same sex, mean ± sd (n = 5 (Vehicle), n = 5 (BAY-826), n = 4 (rapa), n = 4 (BAY-826+rapa) mice). (e, f) Representative whole-mount immunofluorescence images of dermal vasculature of ear skin (e) and quantification (f) of the effect of AAV-TIE2-ECD on control mice not carrying Cre or Pik3caH1047 alleles. Treatment scheme is as described in Fig. 8e (AAV at 3 weeks, 4-OHT induction at 4 weeks, analysis at 8 weeks). Data in (f) represent a change in EMCN+ vessel area relative to untreated control, mean ± sd (n = 3 (untreated), n = 3 (TIE2-ECD) mice). Scale bars: 200 μm (b, e). Source data
Extended Data Fig. 10
Extended Data Fig. 10. TIE2-PI3K-FOXO1 signaling pathway and its dysregulation in Pik3ca-driven VM.
PI3K-AKT pathway regulates diverse cellular processes including protein translation (via TSC1/2-mTORC1) and gene transcription through direct (for example, inhibition of FOXO1) or indirect (for example, activation of β-catenin through inhibition of GSK3β) mechanisms. Examples of other AKT targets involved for example, in the regulation of cell survival (BAD) and vascular tone (eNOS) are indicated. FOXO1 inhibition-dependent PI3K signaling contributes to regulation of cellular metabolism, vascular growth and the acquisition of post-capillary venous phenotype. Activation of the PI3K pathway results in “feedforward” signaling to TIE2 by suppressing FOXO1-regulated expression of the autocrine TIE2 antagonist, ANGPT2. The resulting upstream activation of PI3K signaling is reinforced by an increase in coverage by smooth muscle cells (SMCs) that produce the TIE2 agonist, ANGPT1.

References

    1. Queisser, A., Seront, E., Boon, L. M. & Vikkula, M. Genetic basis and therapies for vascular anomalies. Circ. Res.129, 155–173 (2021). - PubMed
    1. Limaye, N. et al. Somatic mutations in angiopoietin receptor gene TEK cause solitary and multiple sporadic venous malformations. Nat. Genet.41, 118–124 (2009). - PMC - PubMed
    1. Castel, P. et al. Somatic PIK3CA mutations as a driver of sporadic venous malformations. Sci. Transl. Med.8, 332ra42–332ra42 (2016). - PMC - PubMed
    1. Castillo, S. D. et al. Somatic activating mutations in Pik3ca cause sporadic venous malformations in mice and humans. Sci. Transl. Med.8, 332ra43 (2016). - PMC - PubMed
    1. Graupera, M. et al. Angiogenesis selectively requires the p110α isoform of PI3K to control endothelial cell migration. Nature453, 662–666 (2008). - PubMed

MeSH terms

LinkOut - more resources