. 2025 May 24;8(1):796.
doi: 10.1038/s42003-025-08121-9.

Father's adolescent body silhouette is associated with offspring asthma, lung function and BMI through DNA methylation

Affiliations

Father's adolescent body silhouette is associated with offspring asthma, lung function and BMI through DNA methylation

Negusse Tadesse Kitaba et al. Commun Biol. .

Abstract

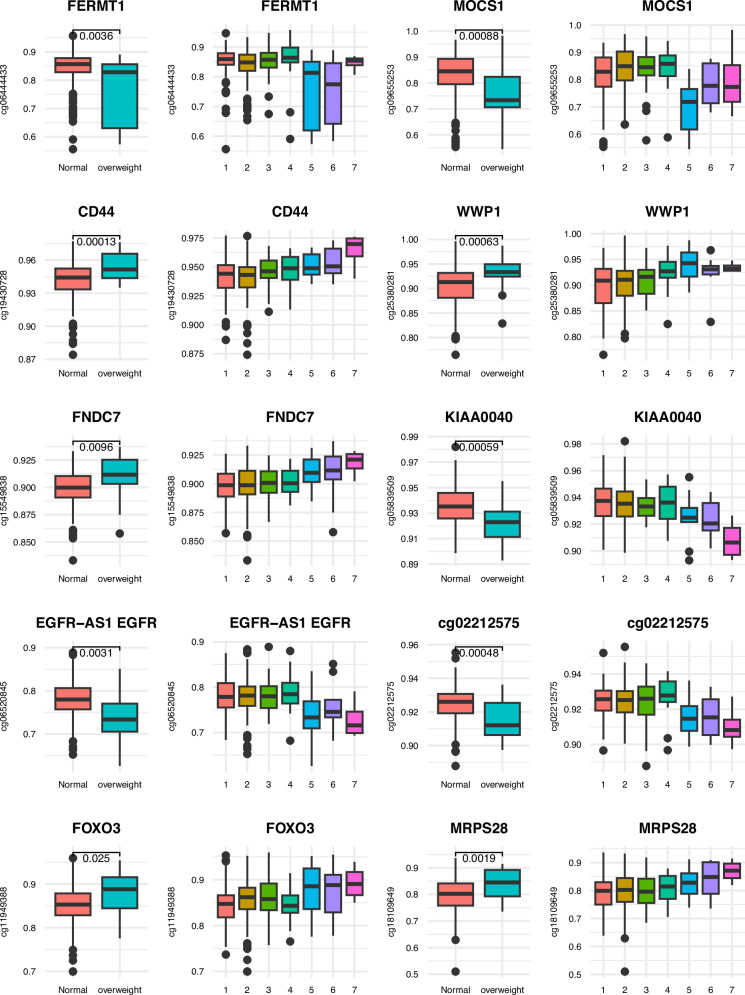
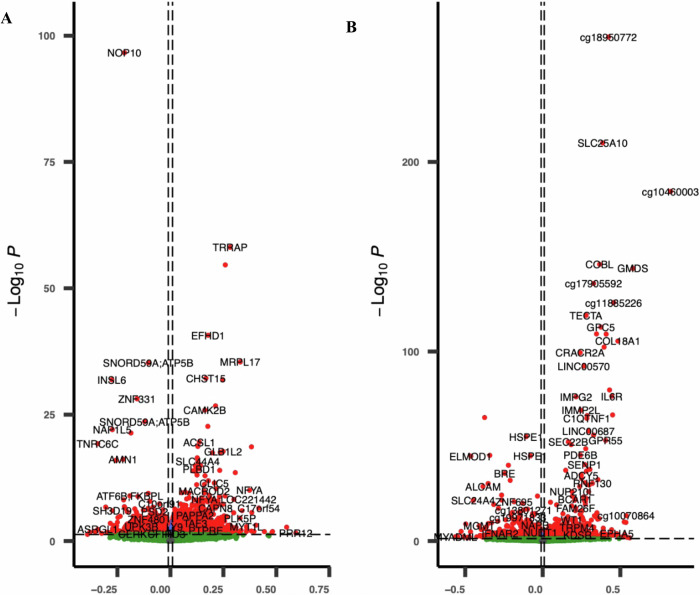
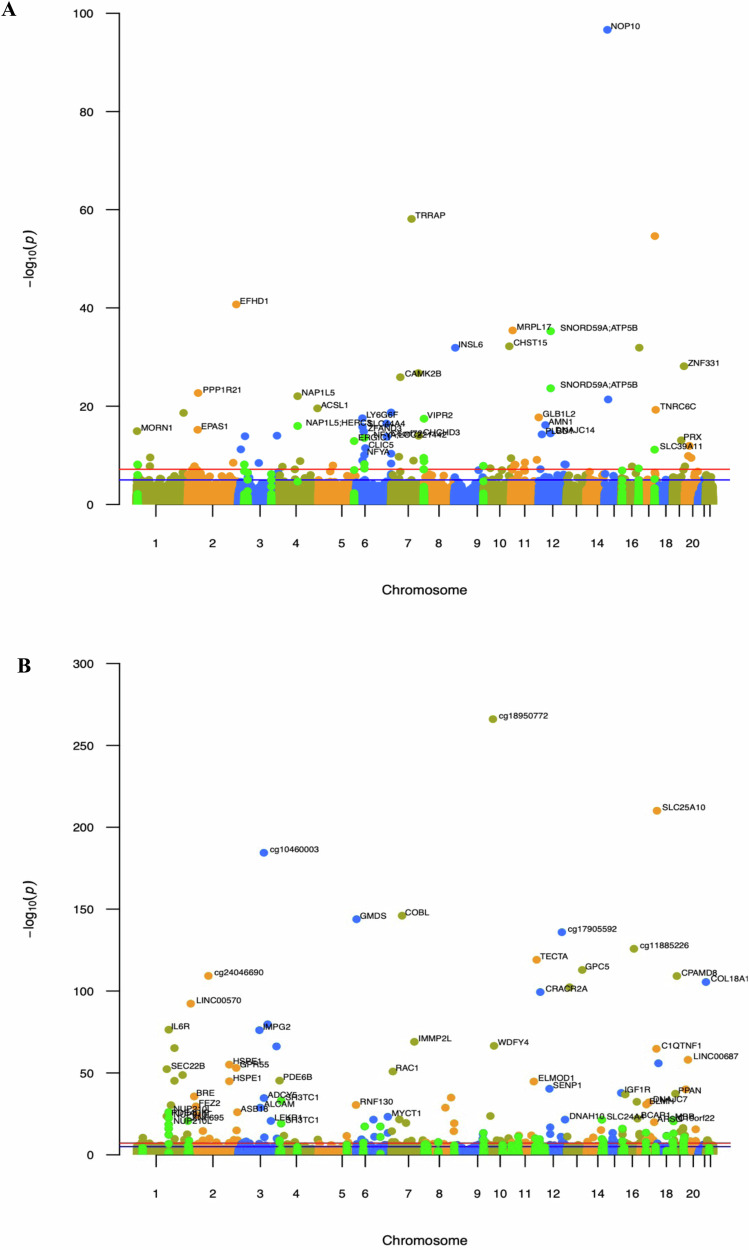
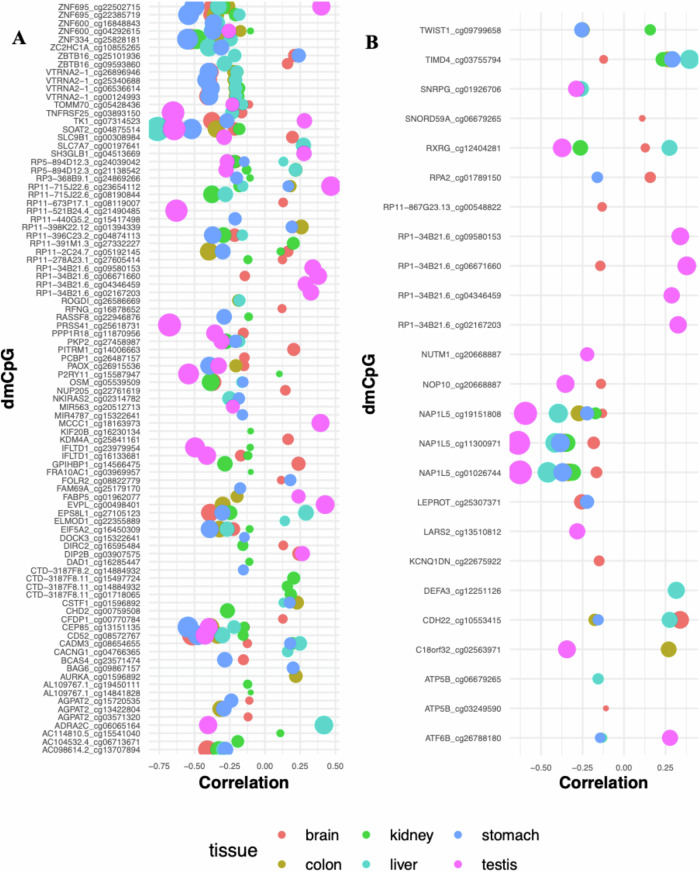
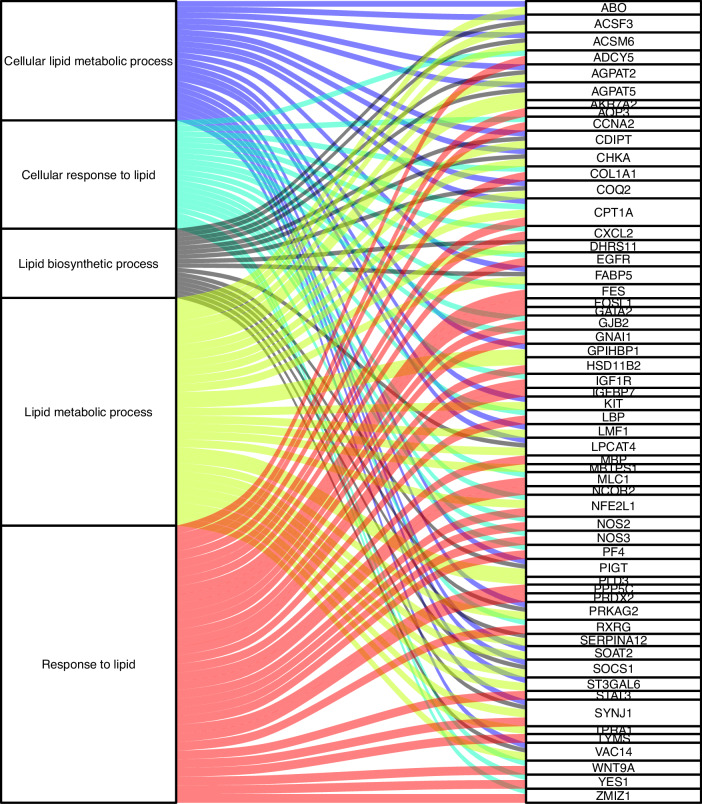
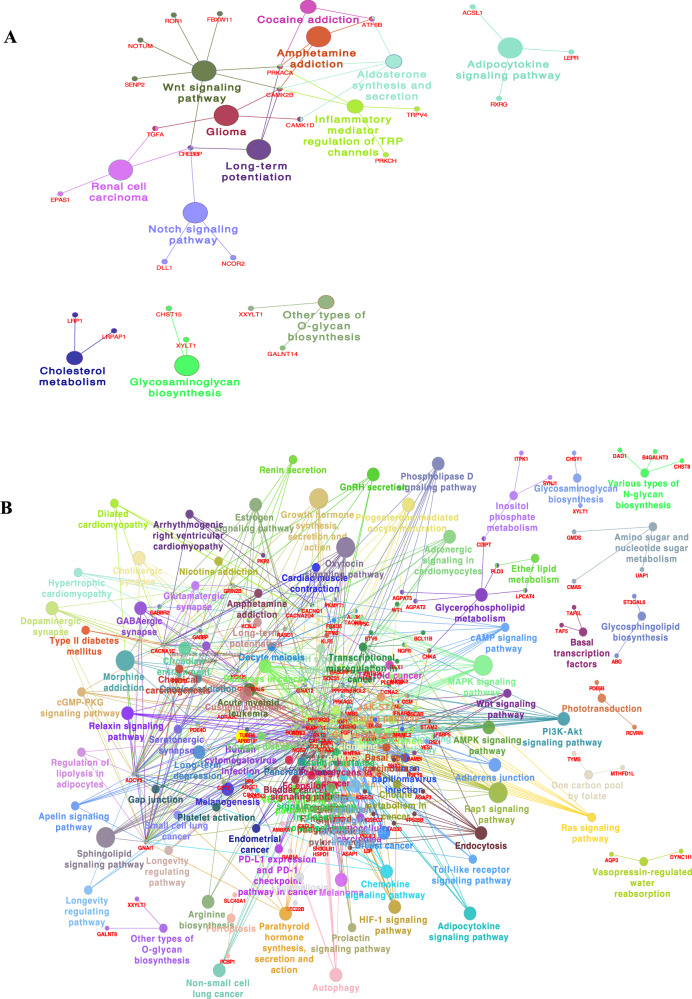
Boys' pubertal overweight associates with future offspring's asthma and low lung function. To identify how paternal overweight is associated with offspring's DNA methylation (DNAm), we conducted an epigenome-wide association study of father's body silhouette (FBS) at three timepoints (age 8, voice break and 30) and change in FBS between these times, with offspring DNAm, in the RHINESSA cohort (N = 339). We identified 2005 differentially methylated cytosine-phosphate-guanine (dmCpG) sites (FDR < 0.05), including dmCpGs associated with offspring asthma (119), lung function (178) and BMI (291). Voice break FBS associated with dmCpGs in loci including KCNJ10, FERMT1, NCK2 and WWP1. Change in FBS across sexual maturation associated with DNAm at loci including NOP10, TRRAP, EFHD1, MRPL17 and NORD59A;ATP5B and showed strong correlation in reduced gene expression in loci NAP1L5, ATP5B, ZNF695, ZNF600, VTRNA2-1, SOAT2 and AGPAT2. We identified 24 imprinted genes including: VTRNA2-1, BLCAP, WT1, NAP1L5 and PTPRN2. Identified pathways relate to lipid and glucose metabolism and adipogenesis. Father's overweight at puberty and during reproductive maturation was strongly associated with offspring DNA, suggesting a key role for epigenetic mechanisms in intergenerational transfer from father to offspring in humans. The results support an important vulnerability window in male puberty for future offspring health.


Conflict of interest statement

Competing interests: The authors declare no competing interests.

Figures

Fig. 1
Fig. 1. Box plots showing the distribution of methylation levels (beta-values) of top 10 dmCpGs (FDR p-value) for FBS at voice break.
The distribution of each dmCpG for the father’s “normal” vs. “overweight” body silhouette, and across the father’s body silhouette numbers 1–7 is shown. The p-value comparing normal vs. overweight is shown above the box plot for each dmCpG.
Fig. 2
Fig. 2. Volcano plot for regression coefficients of dmCpGs associated with a change in father’s body silhouettes.
A Between voice break and age 8 years (FBS-V8c) and B between voice break and age 30 years (FBS-V30c). The X-axis shows regression coefficients, and the Y-axis represents −log10 of the p-values. Positive coefficients show hypermethylated dmCpGs, while the magnitude shows the strength of the association.
Fig. 3
Fig. 3. Manhattan plots showing the genome-wide distribution of dmCpGs associated with a change in father’s body silhouette.
A Between age of 8 years and voice break (FBS-V8c) and B between voice break and age 30 years (FBS-V30c). The x-axis shows the position across autosomal chromosomes. The y-axis represents −log10 of the p-value for each dmCpG (indicated by dots). The green dots show loci with more than 1 dmCpG at FDR-corrected p < 0.05. The top dmCpGs on each chromosome were annotated to the closest gene. For intergenic dmCpGs, CpG name was used.
Fig. 4
Fig. 4. Correlation of methylation level with gene expression for dmCpGs located on gene promoters across 6 tissues, as associated with change in father’s body silhouettes.
A Between voice break and age 30 years (FBS-V30c) (4 sites for VTRNA2-1 and AGPAT2 and 2 sites for IFLTD1, ZNF695, ZNF600 and ZBTB16) and B between voice break and age 8 years (FBS-V8c) (3 sites for NAP1L5 and ATP5B). The dot size corresponds to the level of correlation.
Fig. 5
Fig. 5. Alluvial plot showing the top 5 lipid-related traits gene ontology terms and gene set for dmCpGs associated with father’s body silhouette between voice break and age 30 years (FBS-V30c).
Additional GO terms and related genes are provided in Supplementary Data 6.
Fig. 6
Fig. 6. Network plot showing KEGG for dmCpGs.
A Between voice break and age 8 years (FBS-V8c). B Between voice break and age 30 years (FBS-V30c). Detailed pathways are included in Supplementary Data 7.

References

    1. Bentham, J. et al. Worldwide trends in body-mass index, underweight, overweight, and obesity from 1975 to 2016: a pooled analysis of 2416 population-based measurement studies in 128·9 million children, adolescents, and adults. Lancet390, 2627–2642 (2017). - PMC - PubMed
    1. Lønnebotn, M. et al. Parental prepuberty overweight and offspring lung function. Nutrients14, 1506 (2022). - PMC - PubMed
    1. Johannessen, A. et al. Being overweight in childhood, puberty, or early adulthood: changing asthma risk in the next generation?. J. Allergy Clin. Immunol.145, 791–799.e4 (2020). - PubMed
    1. Bowatte, G. et al. Parental preconception BMI trajectories from childhood to adolescence and asthma in the future offspring. J. Allergy Clin. Immunol.150, 67–74.e30 (2022). - PubMed
    1. Kaati, G. et al. Cardiovascular and diabetes mortality determined by nutrition during parents’ and grandparents’ slow growth period. Eur. J. Hum. Genet.10, 682–688 (2002). - PubMed