. 2025 Aug;32(8):1434-1444.
doi: 10.1038/s41594-025-01558-w. Epub 2025 May 23.

Multiple steps of dynein activation by Lis1 visualized by cryo-EM

Affiliations

Multiple steps of dynein activation by Lis1 visualized by cryo-EM

Agnieszka A Kendrick et al. Nat Struct Mol Biol. 2025 Aug.

Abstract

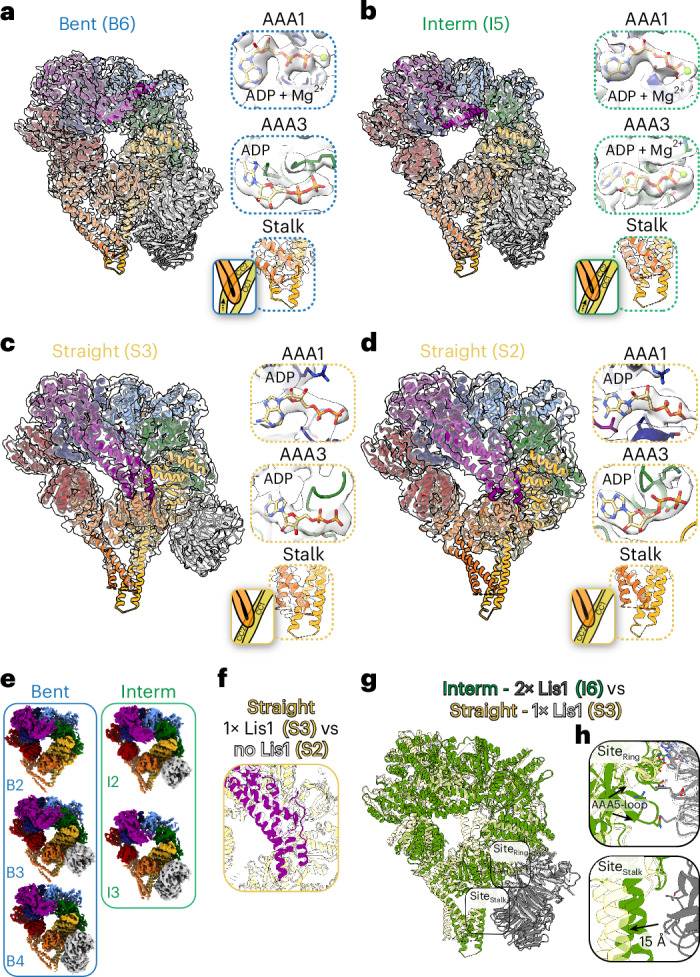
Cytoplasmic dynein-1 (dynein) is an essential molecular motor controlled in part by autoinhibition. Lis1, a key dynein regulator mutated in the neurodevelopmental disease lissencephaly, plays a role in dynein activation. We recently identified a structure of partially autoinhibited dynein bound to Lis1, which suggests an intermediate state in dynein's activation pathway. However, other structural information is needed to fully understand how Lis1 activates dynein. Here, we used cryo-EM and yeast dynein and Lis1 incubated with ATP at different time points to reveal conformations that we propose represent additional intermediate states in dynein's activation pathway. We solved 16 high-resolution structures, including 7 distinct dynein and dynein-Lis1 structures from the same sample. Our data support a model in which Lis1 relieves dynein autoinhibition by increasing its basal ATP hydrolysis rate and promoting conformations compatible with complex assembly and motility. Together, this analysis advances our understanding of dynein activation and the contribution of Lis1 to this process.


Conflict of interest statement

Competing interests: The authors declare no competing interests.

Figures

Fig. 1
Fig. 1. Time-resolved cryo-EM captures Lis1’s effect on dynein’s conformational landscape during ATP hydrolysis.
a, Schematic of dynein domain organization. Lis1 binding at different sites on dynein (sitering and sitestalk) is shown in different dynein conformations. MTBD, microtubule-binding domain. b, The architecture of a nucleotide-binding pocket and Stalk–MTBD communication. c, Schematic of the experimental setup. df, The three major groups of conformations identified in the datasets are shown on locally refined cryo-EM volumes, filtered to 6 Å: straight linker (d), intermediate linker (e), and bent linker (f). The linker region is highlighted in magenta. The extent of ring opening is shown to the left of each panel. g, Different conformations were identified in each dataset in the absence (open circle) or presence of Lis1 (black circle) at two different time points (0.5 min, white background; 30 min, gray background). h, Relative abundance of particles belonging to different states obtained from particle distributions in cryo-EM datasets in the absence (open circle) or presence of Lis1 (black circle) at two different time points (0.5 min, white background; 30 min, gray background). Source data
Fig. 2
Fig. 2. Conformational landscape of dynein during ATP hydrolysis.
a–c, Models of dynein for the bent (B5) (a), intermediate (I4) (b), and straight (S4) (c) conformations from the 30 min dataset fit into their corresponding cryo-EM density maps. Each structural element is colored according to the dynein schematic in Fig. 1a. To the right of each fitted model are close ups of the nucleotide-binding pockets for AAA1 and AAA3, and of the predicted stalk conformations. d, A map of pairwise alpha-carbon distances between the straight linker model (S4) and an X-ray structure of S. cerevisiae dynein in apo-AAA1 (PDB: 4AI6), with the models aligned relative to their AAA1 modules. The length of each vector is proportional to the interatomic distance. Residues 1361–1772 of the linker were removed for clarity. e, Comparison of AAA1 nucleotide-binding pockets for straight linker dynein (S4) bound to ADP with S. cerevisiae in apo-AAA1 (PDB: 4AI6). The models were aligned based on residues 1797–1894 in AAA1. f, Comparison of AAA3 nucleotide-binding pockets for straight linker dynein (S4, left panel, yellow outline) and intermediate linker dynein (I4, right panel, green outline) with S. cerevisiae (PDB: 4AI6). The models were aligned based on residues 2377–2445 in AAA3. g, Map of pairwise alpha-carbon distances between the straight linker (S4) and the intermediate linker (I4) models. The length of each vector is proportional to the interatomic distance. The models were aligned relative to their AAA1 modules. Residues 1361–1772 of the linker were removed for clarity. h, View of linker docking in PDB 4AI6 (left), straight linker conformation (S4, middle), and intermediate linker conformation (I4, right).
Fig. 3
Fig. 3. Lis1 binding to dynein expands dynein’s conformational landscape.
a–d, Models of dynein bound to Lis1 for the bent (B6) (a) and intermediate (I5) (b) dynein from the same dataset (dynein with Lis1 incubated for 30 min with ATP), and straight with Lis1 bound (S3) (c) and straight with no Lis1 bound (S2) (d) dynein from the same dataset (dynein with Lis1 incubated for 0.5 min with ATP), fit into their corresponding cryo-EM density maps. Each structural element is colored according to the dynein schematic in Fig. 1a. To the right of each fitted model are views of the nucleotide binding pockets for AAA1 and AAA3 and of the stalk conformations. e, Additional cryo-EM maps obtained after heterogeneity analysis of bent (blue box) and intermediate (green box) dynein conformations from the dynein with Lis1 incubated for 0.5 min with ATP dataset after 3D classification show one or two Lis1 bound to dynein. f, Comparison of linker (magenta) in straight linker dynein (S3, yellow) bound to Lis1 with linker (white) in straight linker dynein (S2, white) with no Lis1 bound. The models were aligned on the basis of the position of AAA1. g, Comparison of models built for intermediate state dynein (I6, green) bound to two Lis1 β-propellers (gray) with straight linker dynein (S3, yellow) bound to one Lis1 β-propeller (white). The two Lis1-binding sites are highlighted. The models were aligned on the basis of the position of Lis1 bound to sitering. h, The dynein and Lis1 binding sites from g.
Fig. 4
Fig. 4. Lis1 increases dynein’s basal ATPase activity.
ATPase activity of dynein in the presence of increasing concentrations of wild-type Lis1 (black dots) or a Lis1 mutant that does not bind to dynein (Lis15A, red squares). Mean values (± s.d.) from three independent experiments are shown. Each experiment was performed in duplicate. Fitted values (± standard error of the fit); kbasal (basal rate) = 0.837 ± 0.08 s–1, kcat[Lis1] (turnover rate) = 25.75 ± 2.4 s–1. Source data
Fig. 5
Fig. 5. Conformational changes and Lis1 binding regulate dynein’s basal ATP-hydrolysis rate.
a, Schematic of the two important interaction regions between dynein’s linker and motor domain. b, The proximity of the P1 sensor (PS1) and H2 insert loops in AAA2 (blue) to the linker (magenta) hinge region in the indicated models. c, Density maps and close-ups for subsets of particles selected from cryoDRGN analysis that showed the most extensive linker density. Close-ups show predicted linker (magenta) docking sites on AAA4 (yellow) after fitting an extended linker model in the density maps. d, Map of pairwise alpha-carbon distances between the intermediate linker model and the intermediate linker model bound to two Lis1 β-propellers. The models were aligned by their AAA1 modules. Residues 1361–1772 of the linker were removed for clarity. e, Residues 1352–1772 of the linker from the map of pairwise alpha-carbon distances between the intermediate linker model and the intermediate linker model bound to two Lis1 β-propellers in d. f, View of linker docking in intermediate linker dynein bound to Lis1 β-propellers (top) and intermediate linker dynein (bottom). Residue D2686 is highlighted in red. g. View of the location of residue D3045 (yeast D2868) in human dynein Phi particle (PDB: 5NVU). h, Normalized ATPase activity (median ± interquartile range) of GST–dynein and GST–dyneinD2868K. Unpaired t-test with two-tailed P value; *P = 0.0145. Data from four independent experiments. Each experiment was performed in duplicate. i, Normalized ATPase activity (median ± interquartile range) of GST–dyneinD2868K in the absence (white circles) or presence (black circles) of Lis1. Unpaired t-test with two-tailed P-value. ****P < 0.0001. Data are from three independent experiments. Each experiment was performed in duplicate. Source data
Fig. 6
Fig. 6. Molecular dynamics support changes in dynein conformations due to Lis1 binding.
a, The linker rotation angles defined by the Cα atoms of residues located in AAA2 (S1942, corner), linker–corner (L1664–S1924, edge 1), and linker–corner (L1664–K1424, edge 2) for the four systems used in the molecular dynamic simulations: bent linker with one Lis1 β-propellers bound (B7, solid blue line), intermediate linker with one Lis1 β-propeller bound (I6, solid green line), intermediate linker with two Lis1 β-propellers bound (I7, dotted green line), and intermediate linker (I4, large dot green line). b, The population density for the linker rotation angles for the four simulation systems. c, The predicted salt bridge between D2868 in AAA3 and K1424 in the linker for intermediate linker with one Lis1 β-propeller bound (I6, top) and intermediate linker with two Lis1 β-propellers bound (I7, bottom). d, The distribution of the contact area surface between AAA1 and AAA2 (insert, red arrow points to the interface) in the simulations. e, Distribution of contact area surface between AAA3 and AAA4 domains (insert, red arrow points to the interface) in the simulations. f, Model of dynein activation and the proposed placement of the identified structures in the model. (1) Dynein in the Phi particle, (2) the initial step of Chi particle formation, (3) the Chi particle, (4) the increase in dynein’s basal ATP hydrolysis rate, during which dynein likely samples intermediate states, (5) the full dynein complex assembles with dynactin and an activating adapter that binds to microtubules and contains one set of dynein dimers bound to Lis1 (Dyn-A) and another set of dynein dimers without Lis1 (Dyn-B), and (6) Lis1 dissociates from the active dynein complex. The thickness of the arrows in the top panel indicates relative ATP hydrolysis rates. The double-headed arrow indicates dynein’s movement on microtubules, during which dynein samples multiple conformational states. Source data
Extended Data Fig. 1
Extended Data Fig. 1. Cryo-EM data processing workflow for the dynein datasets.
a. Dose-weighted movies from 3 datasets of dynein without Lis1 (0.5 min condition) were aligned with MotionCor2 and CTF was estimated using CCTFFIND4. Particle extraction (binned by 4) was performed in cryoSPARC with a Topaz-trained model. Good particles from 2D classification jobs were used for ab-inito model generation in cryoSPARC. The models in red boxes were carried into the next steps. Fourier shell correlation (FSC) plots are shown next to the final maps. b. Dose-weighted movies from a dataset of dynein without. Lis1 (30 min condition) were aligned with MotionCor2 and CTF was estimated using CCTFFIND4. Particle extraction (binned by 4) was performed in cryoSPARC with a Topaz- trained model. Good particles from 2D classification jobs were used for ab-inito model generation in cryoSPARC. The models in red boxes were carried into the next steps. Fourier shell correlation (FSC) plots are shown next to the final maps.
Extended Data Fig. 2
Extended Data Fig. 2. Cryo-EM data processing workflow for the dynein + Lis1 + ATP 0.5 min dataset.
a. Dose-weighted movies from 4 datasets of dynein with Lis1 (0.5 min condition) were aligned with MotionCor2 and CTF was estimated using CCTFFIND4. Particle extraction (binned by 4) was performed in cryoSPARC with a Topaz-trained model. Good particles from 2D classification jobs were used for ab-inito model generation in cryoSPARC. The models in red boxes were carried into the next steps. Fourier shell correlation (FSC) plots are shown next to the final maps. b. The heterogeneity analysis (cryoDRGN) workflow with particles belonging to the intermediate linker dynein (I1) conformation. A UMAP visualization after analysis is shown and particles that show binding of two Lis1 β-propellers are grouped into the highlighted population (2x Lis1). c. The two maps used to determine the linker position for the intermediate linker dynein with 1x Lis1 bound (left) and 2x Lis1 bound (right).
Extended Data Fig. 3
Extended Data Fig. 3. Cryo-EM data processing workflow for the dynein + Lis1 + ATP 30 min dataset.
Dose-weighted movies from a dataset of dynein with Lis1 (30 min condition) were aligned with MotionCor2 and CTF was estimated using CCTFFIND4. Particle extraction (binned by 4) was performed in cryoSPARC with a Topaz-trained model. Good particles from 2D classification jobs were used for ab-inito model generation in cryoSPARC. The models in red boxes were carried into the next steps. Fourier shell correlation (FSC) plots are shown next to the final maps.
Extended Data Fig. 4
Extended Data Fig. 4. Local resolution and nucleotide occupancies at AAA+ subunits.
Local resolution and views of the nucleotide-binding pockets for the indicated AAA+ modules for a. straight (S), b. intermediate (I), and c. bent (B) linker dynein. Conformations belonging to each category are named with the first letter of that category and are shown in order starting with states identified in the shorter time point (0.5 min, white background) followed by the longer time point (30 min, gray background).
Extended Data Fig. 5
Extended Data Fig. 5. Cryo-EM data processing of the combined datasets.
a. and b. Cryo-EM data processing workflow for the combined datasets. c. Relative abundance of particles belonging to different states obtained from particle distributions in cryo-EM datasets in the absence (open circle) or presence (black circle) of Lis1 at two different time points (0.5-min – white background and 30min – gray background). Source data
Extended Data Fig. 6
Extended Data Fig. 6. Summary of the identified structures and their properties.
Summary of the cryo-EM volumes determined in this work, with their properties, for the indicated datasets. Stalk represents the identified stalk conformations51. S – straight linker conformation, yellow background; I – intermediate linker conformation, green background; and B – bent linker conformation, blue background. a. Dynein + ATP, 0.5 min and 30 min datasets. b. Dynein + ATP + Lis1, 0.5 min dataset. c. Dynein + Lis1 + ATP, 30 min dataset. d. Dynein + Lis1 + ATP, 0.5 min dataset after 3D classifications. e. Dynein + Lis1 + ATP, 30 min dataset after 3D classifications.
Extended Data Fig. 7
Extended Data Fig. 7. Specifics of Lis1 interaction with dynein.
a. Comparison of models build for bent linker dynein bound to 2x Lis1 β-propellers (B8, blue, Lis1 – gray) with bent linker dynein bound to 1x Lis1 β-propellers (B7, white, Lis1 – white). The two Lis1 binding sites are highlighted and shown to the right. b. Comparison of models build for intermediate linker dynein bound to 2x Lis1 β-propellers (I7, green, Lis1 – gray) with intermediate linker dynein bound to 1x Lis1 β-propellers (I6, white, Lis1 – white). The two Lis1 binding sites are highlighted and shown to the right. c. Comparison of models build for bent linker dynein bound to 2x Lis1 β-propellers (B8, blue, Lis1 – white) with intermediate linker dynein bound to 2x Lis1 β-propellers (I7, green, Lis1 – white). The two Lis1 binding sites are highlighted and shown to the right.

Update of

References

    1. Reck-Peterson, S. L., Redwine, W. B., Vale, R. D. & Carter, A. P. The cytoplasmic dynein transport machinery and its many cargoes. Nat. Rev. Mol. Cell Biol.19, 382–398 (2018). - PMC - PubMed
    1. Canty, J. T., Tan, R., Kusakci, E., Fernandes, J. & Yildiz, A. Structure and mechanics of dynein motors. Annu. Rev. Biophys.50, 549–574 (2021). - PMC - PubMed
    1. Amos, L. A. Brain dynein crossbridges microtubules into bundles. J. Cell Sci.93, 19–28 (1989). - PubMed
    1. Torisawa, T. et al. Autoinhibition and cooperative activation mechanisms of cytoplasmic dynein. Nat. Cell Biol.16, 1118–1124 (2014). - PubMed
    1. Zhang, K. et al. Cryo-EM reveals how human cytoplasmic dynein is auto-inhibited and activated. Cell169, 1303–1314 (2017). - PMC - PubMed

MeSH terms

Substances

LinkOut - more resources