. 2025 May 23;26(1):141.
doi: 10.1186/s13059-025-03607-5.

A standardized framework for robust fragmentomic feature extraction from cell-free DNA sequencing data

Affiliations

A standardized framework for robust fragmentomic feature extraction from cell-free DNA sequencing data

Haichao Wang et al. Genome Biol. .

Abstract

Fragmentomics features of cell-free DNA represent promising non-invasive biomarkers for cancer diagnosis. A lack of systematic evaluation of biases in feature quantification hinders the adoption of such applications. We compare features derived from whole-genome sequencing of ten healthy donors using nine library kits and ten data-processing routes and validated in 1182 plasma samples from published studies. Our results clarify the variations from library preparation and feature quantification methods. We design the Trim Align Pipeline and cfDNAPro R package as unified interfaces for data pre-processing, feature extraction, and visualization to standardize multi-modal feature engineering and integration for machine learning.

Keywords: Cancer genomics; CfDNA; Feature extraction; Fragmentomics.


Conflict of interest statement

Declarations. Ethics approval and consent to participate: This study uses commercially available plasma samples of human origin; the respective guidelines have been followed (IRB Tracking Number: 20161665). The experiments conformed to the principles set out in the WMA Declaration of Helsinki and the Department of Health and Human Services Belmont Report. Consent for publication: Not applicable. Competing interests: CGS is currently a member of Neogenomics, and FM is a co-founder and director of Tailor Bio. Neogenomics and Tailor Bio had no role in the conceptualisation and design of the study, statistical analysis, or decision to publish the manuscript.

Figures

Fig. 1
Fig. 1
Overview of the study. a Plasma samples were collected from 10 healthy donors, cfDNA was extracted using QIAsymphony DSP Circulating DNA Kit (QIAGEN) [41], and independent sequencing libraries were made using 9 different kits (Fig. 2 and Additional file 1: Fig. S1). PE 150 bp whole-genome sequencing was performed on Illumina NovaSeq 6000 sequencer. b Trimming and alignment of data. The Trimming Alignment Pipeline (TAP) built using Nextflow [42], designed for library-specific sequencing data trimming and cfDNA-specific alignment. All generated bam files were downsampled to 1 × coverage. c cfDNAPro R package was written for cfDNA feature calculation and visualization. It offers utilities for extracting fragment length, fragment end motif, copy number, and single nucleotide variations from whole-genome sequencing data of cfDNA. In addition, cfDNAPro allows integrated analysis of features, such as gene location annotation on CNV plot, and separating length or motif distribution by mutations. d Healthy and cancer plasma samples were collected from seven published studies (n = 1182, Additional file 2: Table S5). For each patient, when multiple samples are available, only sample from earliest timepoint was kept. PCA analysis revealed the batch effects across datasets
Fig. 2
Fig. 2
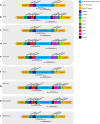
Amplicon structure of different library kits. All libraries are made from double-stranded cfDNA fragments. Kits within the same grey rectangle have the same supplier. a XTHS [43] and b XTHS2 [44] (Agilent Technologies, Inc.). c PlasmaSeq [45],d Tag_seq [46], and e Tag_seq_HV [47] (Takara Bio Inc.). f A library (denoted by “EM_seq” in the manuscript) was made using EM_seq [48] (New England Biolabs), libraries before enzymatic C to T conversion were sequenced. g A library (denoted by “Watchmaker” in the manuscript) prepared with adapters from EF 2.0 Library Preparation and Universal Adapter System [49] (Twist Bioscience), and enzymes from Watchmaker [50] (Watchmaker Genomics). h KAPA_HyperPrep kits (Roche) [51]. i NEBNext_Ultra_II DNA Library Prep Kit for Illumina (New England Biolabs) [52]. The nucleotide sequences of P5/P7 adapter, i5/i7 adapter and i5/i7 stem are shown in Additional file 1: Fig. S1
Fig. 3
Fig. 3
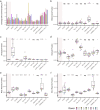
Sequencing data statistics. The metrics of each library kit group were compared with the median values (i.e., the median value of each donor across all library kits). a Raw sequencing coverage. All samples were downsampled to 1 × as indicated by horizontal dash line. Statistics shown in other panels were based on downsampled BAM files. b The fraction of mitochondrial reads. c Fraction of unmapped reads. d Fraction of mismatched bases. e Mean GC content per read. f Standard deviation (SD) of GC content of reads. Wilcoxon test (two-sided) was used for all statistical comparisons. ns: p > 0.05, *: p ≤ 0.05, **: p ≤ 0.01, ***: p ≤ 0.001, ****: p ≤ 0.0001
Fig. 4
Fig. 4
Fragment length definition and analytical impacts. The definition of “fragment length” in this study in ambiguous (a) and straightforward (b) scenarios. c A problematic way to calculate “fragment length.” Median distribution of all donors is shown; each facet shows different trimming-alignment parameters (Table 2). di Fragment length distribution with problematic length calculation. jo Fragment length profile with correct fragment length calculation. Black triangles depict areas with artifacts. Fragment lengths were calculated using the callLength() implemented in cfDNAPro (Fig. 7a). p Fragment length distribution (median of all donors) of four ranges (50–59 bp, 100–150 bp, 151–220 bp, and 300–380 bp) calculated using TrimBwamem2LengthPrior settings. q For each donor using each library, sum of fraction in length ranges are shown. ns: p > 0.05, *: p ≤ 0.05, **: p ≤ 0.01, ***: p ≤ 0.001, ****: p ≤ 0.0001
Fig. 5
Fig. 5
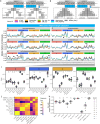
Fragment end motif definitions and variation comparison. ab Definitions of eight types of motifs. ch Line plots showing “s3” motifs frequency with and without correct fragment definition. ce Panels on the left are results derived from analyses without trimming steps. fh The right panels are the results of library-specific adapter trimming. All results shown here are those with correct fragment definition (Fig. 4a). Black triangles highlighted examples of abnormal s3 motifs regions for Tag_seq and Watchmaker. i Sum of fractions of motif starting with A, C, G, and T in h. j Pairwise correlation between lines in h. k Correlation between each donor’s motif profile and the median s3 motif distribution across all donors. ns: p > 0.05, *: p ≤ 0.05, **: p ≤ 0.01, ***: p ≤ 0.001, ****: p ≤ 0.0001
Fig. 6
Fig. 6
Principal component analysis of length and motif features derived from healthy samples. For each plot, 95% confidence area surrounding the group mean value was shown by ellipses. a The PCA analysis of fragment lengths. b PCA analysis of fragment s3 motifs. c The number of healthy plasma samples derived from published studies. d PCA analysis of fragment lengths and grouped by library kit. e PCA of s3 motifs of samples from various studies and grouped by library kit. f PCA of harmonized s3 motifs
Fig. 7
Fig. 7
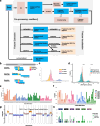
cfDNAPro as an integrated framework for multi-modal analysis. a Schematic overview of the cfDNAPro architecture. b Three types of SNV mutation overlap scenarios used for mutation quality control in cfDNAPro: Concordant overlap (CO), Single read overlap (SO), and Discordant overlap (DO). c Fragment length analysis using the callLength() and plotLength() with highlight length regions of interest. d Combining the length and mutation features. e-f s3 motif frequency plots with and without fragment stratification by carrying mutations or not. g Copy number analysis methods integrated with mutational annotation. Copy number gain, neutral and loss bins were highlighted using orange, grey and blue colours respectively. Bin(s) overlapped with the PKHD1L1 gene are highlighted with the number of mutated fragments and total number of fragments overlapping the gene region. h Trinucleotide single base substitution (SBS) profile of a lung cancer patient, stratified by mutationstatus at individual genomic loci. DO substitutions are highlighted with light yellow patterned lines

References

    1. Wan JCM, Massie C, Garcia-Corbacho J, Mouliere F, Brenton JD, Caldas C, et al. Liquid biopsies come of age: towards implementation of circulating tumour DNA. Nat Rev Cancer. 2017;17:223. - PubMed
    1. Thierry AR, El Messaoudi S, Gahan PB, Anker P, Stroun M. Origins, structures, and functions of circulating DNA in oncology. Cancer Metastasis Rev. 2016;35:347–76. - PMC - PubMed
    1. Mouliere F, Smith CG, Heider K, Su J, van der Pol Y, Thompson M, et al. Fragmentation patterns and personalized sequencing of cell-free DNA in urine and plasma of glioma patients. EMBO Mol Med. 2021;13: e12881. - PMC - PubMed
    1. Dennis Lo YM, Corbetta N, Chamberlain PF, Rai V, Sargent IL, Redman CWG, et al. Presence of fetal DNA in maternal plasma and serum. Lancet. 1997;350:485-7. - PubMed
    1. Burnham P, Dadhania D, Heyang M, Chen F, Westblade LF, Suthanthiran M, et al. Urinary cell-free DNA is a versatile analyte for monitoring infections of the urinary tract. Nat Commun. 2018;9:2412. - PMC - PubMed

Substances

LinkOut - more resources