. 2025 May 23;22(1):138.
doi: 10.1186/s12974-025-03459-7.

Diverse cell types establish a pathogenic immune environment in peripheral neuropathy

Affiliations

Diverse cell types establish a pathogenic immune environment in peripheral neuropathy

Julie Choi et al. J Neuroinflammation. .

Abstract

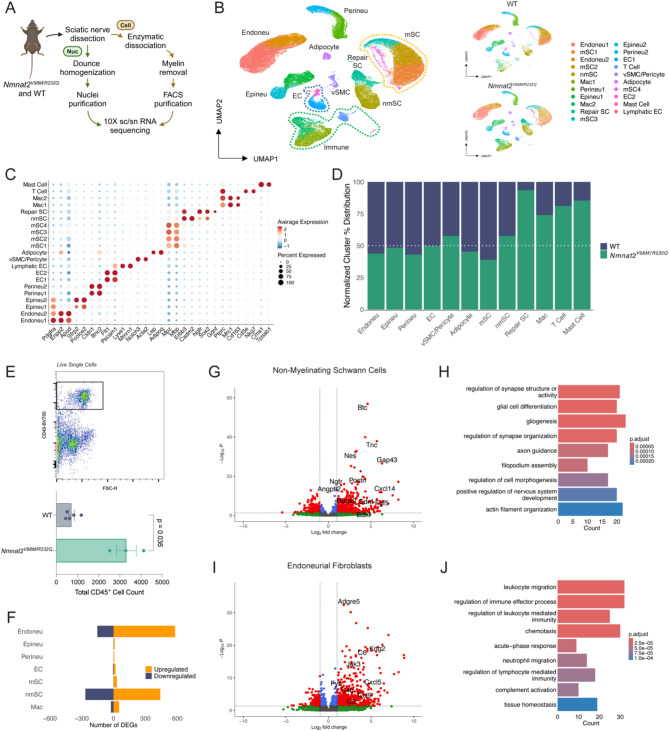
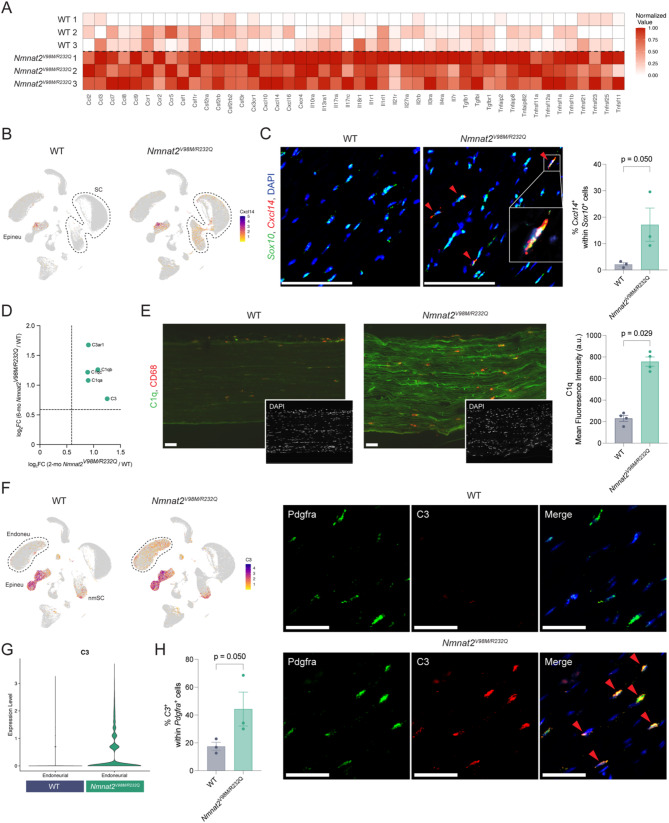
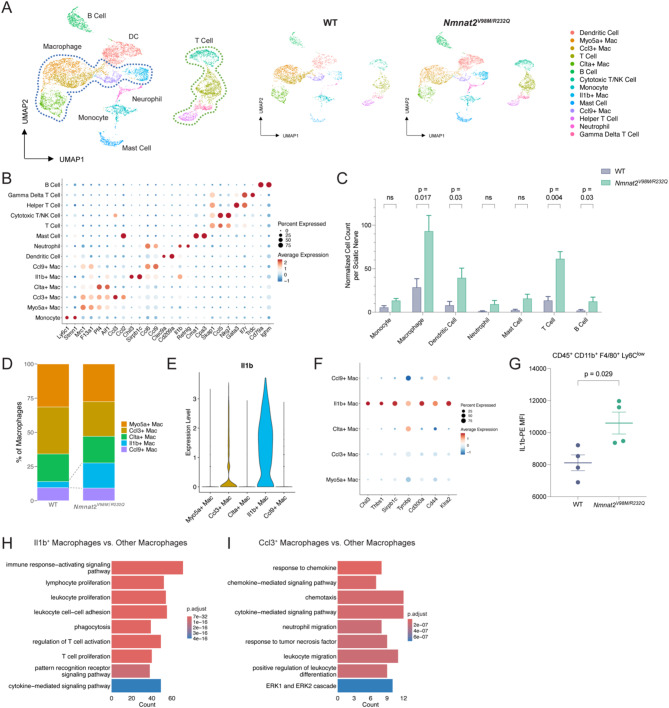
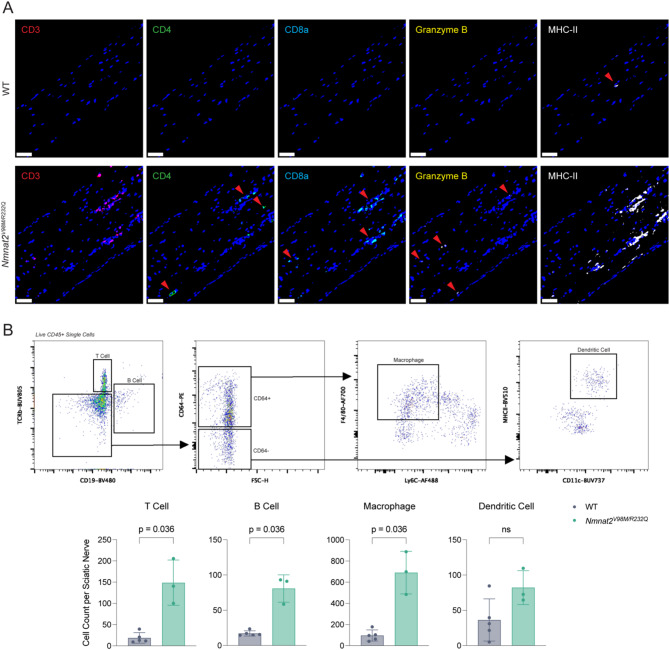
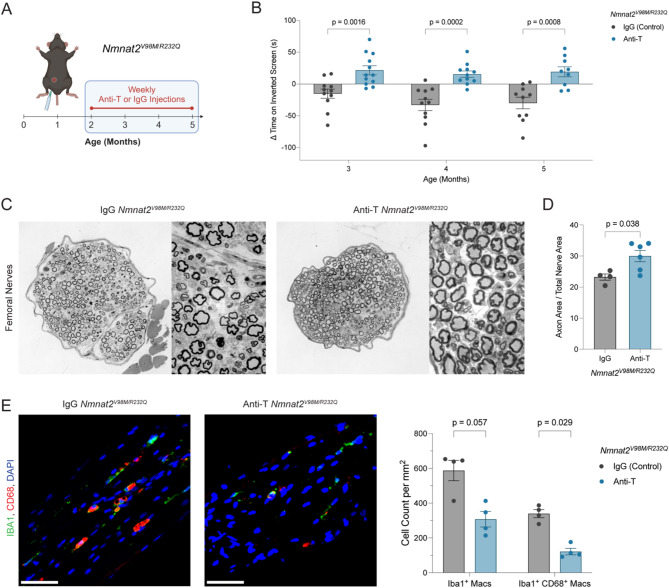
Neuroinflammation plays a complex and context-dependent role in many neurodegenerative diseases. We identified a key pathogenic function of macrophages in a mouse model of a rare human congenital neuropathy in which SARM1, the central executioner of axon degeneration, is activated by hypomorphic mutations in the axon survival factor NMNAT2. Macrophage depletion blocked and reversed neuropathic phenotypes in this sarmopathy model, revealing SARM1-dependent neuroimmune mechanisms as key drivers of disease pathogenesis. In this study, we investigated the impact of chronic subacute SARM1 activation on the peripheral nerve milieu using single cell/nucleus RNA-sequencing (sc/snRNA-seq). Our analyses reveal an expansion of immune cells (macrophages and T lymphocytes) and repair Schwann cells, as well as significant transcriptional alterations to a wide range of nerve-resident cell types. Notably, endoneurial fibroblasts show increased expression of chemokines (Ccl9, Cxcl5) and complement components (C3, C4b, C6) in response to chronic SARM1 activation, indicating enhanced immune cell recruitment and immune response regulation by non-immune nerve-resident cells. Analysis of CD45+ immune cells in sciatic nerves revealed an expansion of an Il1b+ macrophage subpopulation with increased expression of markers associated with phagocytosis and T cell activation/proliferation. We also found a significant increase in T cells in sarmopathic nerves. Remarkably, T cell depletion rescued motor phenotypes in the sarmopathy model. These findings delineate the significant changes chronic SARM1 activation induces in peripheral nerves and highlights the potential of immunomodulatory therapies for SARM1-dependent peripheral neurodegenerative disease.

Keywords: Complement; Cytokines; Endoneurial fibroblasts; Macrophages; NMNAT2; Nerve-resident cells; Neuroinflammation; Repair Schwann cells; SARM1; Sarmopathy; T cells.


Conflict of interest statement

Declarations. Competing interests: JM and AD are co-founders, scientific advisory board members, and shareholders of Disarm Therapeutics, a wholly owned subsidiary of Eli Lilly and scientific advisory board members of Asha Therapeutics. The authors have no other competing conflicts or financial interests.

Figures

Fig. 1
Fig. 1
sc/snRNA-seq of Nmnat2V98M/R232Q sciatic nerves reveals immune cell expansions and transcriptomic alterations in nerve-resident cells. (A) Schematic of sc/snRNA-seq experimental workflow for 2-3-month-old WT (C57BL/6) and Nmnat2V98M/R232Q mice. (B) Integrated UMAP visualization of cells from WT and Nmnat2V98M/R232Q sciatic nerves (n = 101,263; single cell = 42,984; single nucleus = 58,279) and UMAP visualization of WT (n = 48,785) and Nmnat2V98M/R232Q (n = 52,478) side-by-side. Colors correspond to different cell clusters. Endoneu, endoneurial fibroblast; Epineu, epineurial fibroblast; perineu, perineurial fibroblast; EC, endothelial cell; vSMC/pericyte: vascular smooth muscle cell and pericyte; mSC, myelinating Schwann cell; nmSC, non-myelinating Schwann cell; repair SC, repair Schwann cell; Mac, macrophage. (C) Dot plot of scaled average canonical marker gene expression used to differentiate and classify cell clusters. (D) Stacked bar plot of normalized cell type proportions in WT and Nmnat2V98M/R232Q. Data was normalized to account for the difference in the total cell count (cluster cell count / normalization factor, where normalization factor = total cell count / largest total cell count). (E) Flow cytometry quantification of total number of live single CD45+ immune cells in WT and Nmnat2V98M/R232Q sciatic nerves. Data are presented as mean ± SEM. Significance was determined using Mann-Whitney test. (F) Number of genes with significantly increased or decreased expression (log2FC >|1| and adjusted p-value < 0.05) per major cell type in Nmnat2V98M/R232Q compared to WT nerves. (G) Volcano plot and (H) Gene Ontology (GO) terms of differentially expressed genes (DEGs) in non-myelinating SCs in Nmnat2V98M/R232Q compared to WT. (I) Volcano plot and (J) GO terms of DEGs in endoneurial fibroblasts in Nmnat2V98M/R232Q compared to WT. DEGs with log2FC > 1 and adjusted p-value < 0.05 were used for volcano plot visualization and GO term analysis
Fig. 2
Fig. 2
Chronic SARM1 activation induces expression of cytokines and complement in nerve-resident cells of Nmnat2V98M/R232Q mice. (A) Heatmap of normalized cytokine and chemokine mRNA value in bulk RNA-seq data from 2-3-month-old WT and Nmnat2V98M/R232Q mice (3 replicates per condition). Color scale normalized by the highest and the lowest expressions across each cytokine. (B) UMAP of scaled Cxcl14 mRNA expression in sc/snRNA-seq of WT and Nmnat2V98M/R232Q nerves. (C) Representative RNA FISH images and percentage quantification of Sox10 and Cxcl14 in 2-3-month-old WT and Nmnat2V98M/R232Q sciatic nerves (n = 3 per genotype). Scale bar: 100 μm. Data presented as mean ± SEM. Significance was determined using Mann-Whitney test. (D) Fold change in complement related bulk mRNA expression in 2-month-old and 6-month-old Nmnat2V98M/R232Q sciatic nerves compared to WT (n = 3 per condition). (E) Representative images and mean fluorescence intensity (MFI) quantification of CD68 (activated macrophages) and C1q (C1q complement components) immunofluorescence in sciatic nerves of 2-3-month-old WT and Nmnat2V98M/R232Q mice. Inset shows DAPI (nuclei) staining for same images. Scale bar: 50 μm. Data presented as mean ± SEM. Significance was determined using Mann-Whitney test. (F) UMAP of scaled C3 mRNA expression in sc/snRNA-seq of WT and Nmnat2V98M/R232Q. (G) Violin plot of C3 mRNA expression in sc/snRNA-seq of WT and Nmnat2V98M/R232Q endoneurial fibroblasts. (H) Representative RNA FISH images and percentage quantification of Pdgfra (green) and C3 (red), merged with DAPI (blue) in 2-3-month-old WT and Nmnat2V98M/R232Q sciatic nerves (n = 3 per genotype). Scale bar: 50 μm. Data presented as mean ± SEM. Significance was determined using Mann-Whitney test
Fig. 3
Fig. 3
Analysis of CD45+ immune cells reveals expansion of Il1b+ macrophages in Nmnat2V98M/R232Q nerves. (A) Integrated UMAP visualization of CD45+ immune cells from WT and Nmnat2V98M/R232Q sciatic nerves (n = 10,140 cells) and side-by-side UMAP visualization of WT (n = 3,015) and Nmnat2V98M/R232Q (n = 7,125). The immune cell subclusters from scRNA-seq are integrated with FACS CD45+ scRNA-seq data. Colors correspond to different cell clusters. Mac, macrophage; NK, natural killer cell. (B) Dot plot of scaled average canonical marker gene expression used to differentiate and classify immune cell clusters. (C) Bar graph of normalized immune cell count accounting for the number of sciatic nerves in each group (normalized cell count = cluster cell count / number of sciatic nerves pooled for the sample). Data presented as mean ± SEM. Significance was determined using Mann-Whitney test. (D) Cluster distribution of macrophage (Mac) subclusters in WT and Nmnat2V98M/R232Q nerves. (E) Violin plot of scaled Il1b mRNA expression in macrophage clusters. (F) Dot plot illustrating scaled expression of differentially expressed genes in Il1b+ macrophages including inflammation (Chil3, Thbs1, Sirpb1c, Tyrobp), phagocytosis related (Cd300a), and T cell proliferation/activation related (Cd44, Klra2) genes. (G) Flow cytometry MFI analysis of IL1b expression in CD45+ CD11b+ F4/80+ Ly6Clow macrophages in nerves from 2-3-month-old WT and Nmnat2V98M/R232Q mice (n = 4 per genotype). Data presented as mean ± SEM. Significance was determined using Mann-Whitney test. (H) Enriched Gene Ontology (GO) terms associated with Il1b+ macrophages or (I) Ccl3+ macrophages compared to other macrophage populations. DEGs with log2FC > 1 and adjusted p-value < 0.05 were used for GO term analysis
Fig. 4
Fig. 4
T lymphocytes are increased in peripheral nerves of Nmnat2V98M/R232Q mice. (A) Representative images of CD3, CD4, CD8a, granzyme B, and MHC-II immunofluorescence of 2-3-month-old WT and Nmnat2V98M/R232Q femoral nerves using PhenoCycler-Fusion multiplexed imaging. Scale bar: 50 μm. (B) Flow cytometry gating strategy and quantification of live adaptive immune cells (T cells and B cells) and antigen presenting cells (macrophages and dendritic cells) in 2-3-month-old WT and Nmnat2V98M/R232Q sciatic nerves. Each dot in the graph corresponds to an individual sciatic nerve. Data are presented as mean ± SEM. Significance was determined using Mann-Whitney test
Fig. 5
Fig. 5
T cell depletion in Nmnat2V98M/R232Q mice prevents motor deficits and femoral axon loss. (A) Schematic of T cell depletion experimental workflow in Nmnat2V98M/R232Q mice. Mice were injected with anti-CD4 & anti-CD8 neutralizing antibodies (n = 10) or IgG control (n = 12) weekly from two to five months of age. Two months-old was selected as a critical intervention timepoint prior to axon loss but after onset of neuroinflammation. (B) Changes in motor function of IgG-treated (n = 10) and T cell-depleted Nmnat2V98M/R232Q mice (n = 12) from three months to five months measured as changes in inverted screen latency time to fall compared to the baseline measurement for each mouse prior to treatment at two months. Data are presented as mean ± SEM. Significance was determined using mixed-effects analysis with Geisser-Greenhouse correction and Sidak’s multiple comparisons. (C) Representative images of femoral nerves from IgG-treated and T cell-depleted Nmnat2V98M/R232Q mice at five months at 20X and 100X magnification. (D) Percent axonal area/total nerve area for femoral nerves calculated at five months after three months of T cell depletion (n = 6) or treatment with IgG control (n = 4). Data presented as mean ± SEM. Significance was determined using Mann-Whitney test. (E) Representative images and quantification of Iba1+ and CD68+ macrophages of femoral nerves in IgG control and T cell-depleted Nmnat2V98M/R232Q nerves at five months (n = 4). Scale bar: 50 μm. Data presented as mean ± SEM. Significance was determined using Mann-Whitney test

References

    1. Coleman MP, Höke A. Programmed axon degeneration: from mouse to mechanism to medicine. Nat Rev Neurosci. 2020;21:183–96. - PMC - PubMed
    1. Dingwall CB, Strickland A, Yum SW, Yim AK, Zhu J, Wang PL, et al. Macrophage depletion blocks congenital SARM1-dependent neuropathy. J Clin Invest. 2022;132:e159800. - PMC - PubMed
    1. Figley MD, DiAntonio A. The SARM1 axon degeneration pathway: control of the NAD + metabolome regulates axon survival in health and disease. Curr Opin Neurobiol. 2020;63:59–66. - PMC - PubMed
    1. Krauss R, Bosanac T, Devraj R, Engber T, Hughes RO. Axons matter: the promise of treating neurodegenerative disorders by targeting SARM1-Mediated axonal degeneration. Trends Pharmacol Sci. 2020;41:281–93. - PubMed
    1. Gerdts J, Summers DW, Sasaki Y, DiAntonio A, Milbrandt J. Sarm1-mediated axon degeneration requires both SAM and TIR interactions. J Neurosci. 2013;33:13569–80. - PMC - PubMed

MeSH terms