. 2025 May 23;22(1):137.
doi: 10.1186/s12974-025-03448-w.

Gut microbiota deficiency reduces neutrophil activation and is protective after ischemic stroke

Affiliations

Gut microbiota deficiency reduces neutrophil activation and is protective after ischemic stroke

Ali A Tuz et al. J Neuroinflammation. .

Abstract

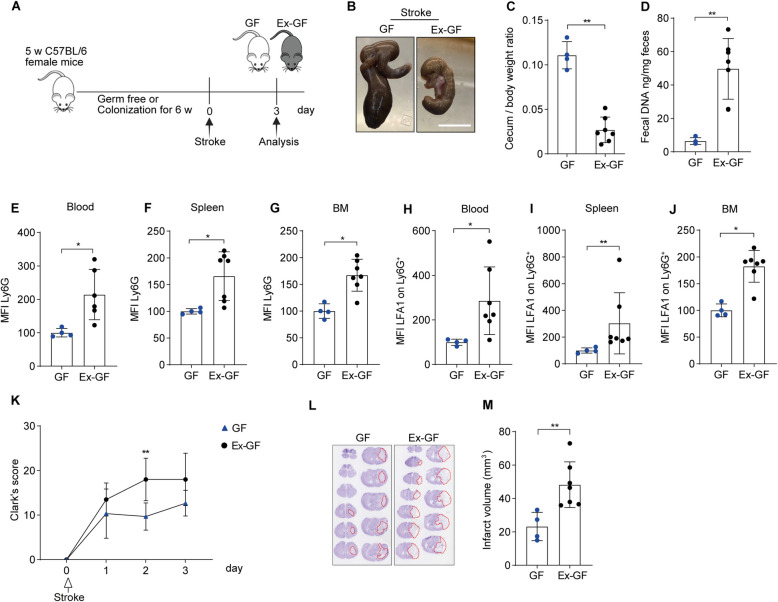
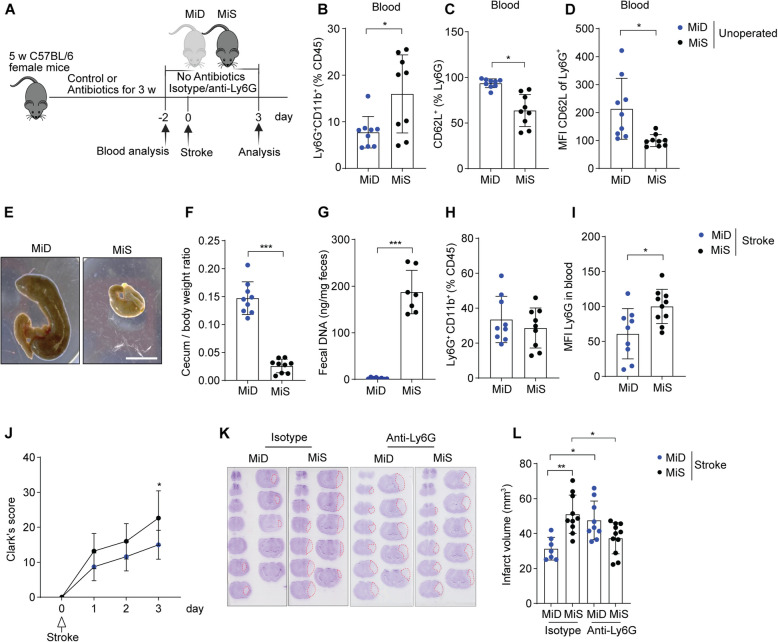
Neutrophils are readily activated immune cells after ischemic stroke in mice and patients. Still, the impact of gut microbiota on neutrophil activation and its influence on inflammatory brain injury remain undefined. We report that natural microbiota colonization of germ-free (GF) mice induces substantial neutrophil activation and deteriorates stroke pathology. The colonized Ex-GF stroke mice had considerably larger infarct sizes and higher sensorimotor deficits than GF littermates. Furthermore, employing an antibiotic-based mouse model of microbiota deficiency, we demonstrate that gut microbiota depletion induces a juvenile neutrophil phenotype characterized by the upregulation of resting state surface receptors, reduced inflammatory proteins, and levels of circulating NETs. This disarming of neutrophil responses was associated with decreased expression of brain inflammatory genes, vascular thrombus formation, reduced infarct size, and alleviated behavioral deficits. We conclude that gut microbes strongly influence neutrophil activation after stroke and thus directly contribute to stroke severity.

Keywords: Gut microbiota; Inflammation; Ischemic stroke; Neutrophils.


Conflict of interest statement

Declarations. Ethics approval and consent to participate: All experiments were performed with local government approval by the Regional Office for Nature, Environment and Consumer Protection of North Rhine-Westphalia, Germany (Landesamt für Natur, Umwelt und Verbraucherschutz Nordrhein-Westfalen) in accordance with EU guidelines (Directive 2010/63/EU) for the care and use of laboratory animals and reported according to ARRIVE guidelines. Competing interests: The authors declare no competing interests.

Figures

Fig. 1
Fig. 1
Gut microbiota trigger neutrophil activation, and increase brain infarcts and sensorimotor deficits. A Scheme illustrating the experimental design. B Images showing caecum size in GF and Ex-GF stroke mice. Scale bar = 1 cm. C Cecum/body weight ratio in GF and Ex-GF stroke mice. D Total bacterial DNA (ng) per mg fecal samples from GF and Ex-GF stroke mice. E–G Mean fluorescence intensity (MFI) of Ly6G on neutrophils in blood, spleen and tibial BM in GF and Ex-GF stroke mice three days after surgery. Values are normalized to GF controls and presented as percentages relative to the 100% MiS mean. H-J MFI of LFA1 on neutrophils in blood, spleen, and tibial BM in GF and Ex-GF stroke mice. K Clark’s score for GF and Ex-GF mice after one to three days of ischemic stroke. L Representative images of cresyl violet stained brain sections from GF and Ex-GF stroke mice. The red outline marks the infarct regions. M Brain infarct volumes (mm3) of GF and Ex-GF mice after three days of stroke. Data are analyzed by the unpaired Mann–Whitney U test, *p < 0.05, **p < 0.01, n = 4–7 mice per group. GF = germ-free, BM = bone marrow
Fig. 2
Fig. 2
Gut microbiota deficiency reduces neutrophil activation and is protective to injured stroke brain. A Scheme illustrating experimental design. B The percentages of Ly6G+CD11b+ blood neutrophils in unoperated MiD and MiS mice. C The frequency of CD62L+ neutrophils in the blood of MiD and MiS unoperated mice. D Mean fluorescence intensity (MFI) of CD62L+ on blood neutrophils in MiD and MiS unoperated mice. Values are normalized to MiS controls and presented as percentages relative to the 100% MiS mean. E Images showing caecum size in MiD and MiS stroke mice three days after surgery. Scale bar = 1 cm. F Cecum-body weight ratio in MiS and MiD stroke mice. G Total bacterial DNA (ng) per mg fecal samples from MiD and MiS stroke mice. H The frequency of Ly6G+CD11b+ blood neutrophils in MiD and MiS stroke mice three days after surgery. I MFI of Ly6G in blood neutrophils of MiD and MiS stroke mice. Values are normalized to MiS controls and presented as a percent decrease. J Clark’s score for MiD and MiS mice after one to three days of ischemic stroke. K Representative images of cresyl violet stained brain sections of MiD and MiS stroke mice treated with isotype or anti-Ly6G antibody. The red outline marks the infarct regions. L Brain infarct volumes of MiD and MiS mice after three days of stroke. Data are analyzed by the unpaired Mann–Whitney U test for two groups and the Kruskal–Wallis test for multiple comparisons, *p < 0.05, **p < 0.01, ***p < 0.001, n = 7–10 mice per group. MiD = microbiota-deficient, MiS = microbiota sufficient
Fig. 3
Fig. 3
Microbiota induce inflammatory proteome in neutrophils after stroke. A Schematic representation of the experimental paradigm. B Principal component analysis (PCA) of the blood neutrophil proteome in MiD and MiS stroke mice one day after surgery (n = 3 mice per group). C Heat map illustrating differentially expressed proteins (fold change > 1.5 or < 0.5, p-value < 0.05) associated with proinflammatory response and extracellular matrix organization in both MiD and MiS stroke mice. The color bar represents the relative z-score, which indicates relative abundance. Red cells represent higher abundance or upregulated proteins, while blue cells represent lower abundance or downregulated proteins. D Functional annotation of differentially regulated proteins between two groups. The biological processes with p-value < 0.05 were ranked by their protein abundance, and the top eight pathways are shown here. E Quantification of cit-H3 complexes in plasma of MiD and MiS stroke mice at 6 h and 24 h after surgery. Data are analyzed by the unpaired Mann–Whitney U test, **p < 0.01, n = 8 mice per group. MiD = microbiota-deficient, MiS = microbiota-sufficient
Fig. 4
Fig. 4
Gut microbiota support the appearance of activated neutrophils in the ischemic brain. A Schematic representation of the experimental paradigm. B Number of CD62L+Ly6G+CD11b+ neutrophils in the ischemic hemispheres of MiD and MiS stroke mice one day after surgery. C-D Mean fluorescence intensity (MFI) of CXCR4 and CD206 on brain-infiltrating neutrophils in MiD and MiS stroke mice. Values are normalized to MiS controls and presented as percentages relative to the 100% MiS mean. E Functional annotation of differentially regulated proteins between two groups. The biological processes with p-value < 0.05 were ranked by their protein abundance and the top eight pathways are shown here. F Heat map illustrating the proteins uniquely detected in ischemic brain-infiltrated neutrophils in MiS stroke mice but not in MiD mice. The color bar represents the relative z-score, which indicates relative abundance. Blue cells represent no abundance, while red cells represent the presence of the proteins. G LSFM brain imaging of MiD and MiS mice one day after stroke. (Left) Whole brain overview image, rendered on 100 µm slicer. Delineation of the infarct region visible in tissue autofluorescence (circled by a dashed white line). Scale bar, 2000 µm. (Right) 3D-rendered LSFM images of GP1bβ+ (cyan) platelet aggregates, Ly6G+ neutrophils (yellow) and CD31+ (red) brain vasculature of mice one day after stroke. White arrows indicate platelet aggregates and neutrophils in the ischemic brain. Scale bar, 200 µm. H High-resolution image showing 3D surface rendering for GP1b β+, Ly6G+, and CD31+ signals in ischemic brain vasculature. GP1b β+ surfaces were used for quantification of platelet aggregate volumes. I Quantification of total GP1b β+ aggregate volumes (× 106 μm3) within CD31+ microvasculature of 6 mm3 ipsilateral brain region of MiD and MiS stroke mice. Data are analyzed using the unpaired Mann–Whitney U test for two-group comparisons, *p < 0.05, n = 4–8 mice per group. MiD = microbiota-deficient, MiS = microbiota-sufficient

References

    1. Maestrini I, Strbian D, Gautier S, Haapaniemi E, Moulin S, Sairanen T, Dequatre-Ponchelle N, Sibolt G, Cordonnier C, Melkas S, et al. Higher neutrophil counts before thrombolysis for cerebral ischemia predict worse outcomes. Neurology. 2015;85:1408–16. - PMC - PubMed
    1. El Amki M, Gluck C, Binder N, Middleham W, Wyss MT, Weiss T, Meister H, Luft A, Weller M, Weber B, Wegener S. Neutrophils Obstructing Brain Capillaries Are a Major Cause of No-Reflow in Ischemic Stroke. Cell Rep. 2020;33:108260. - PubMed
    1. Cai W, Liu S, Hu M, Huang F, Zhu Q, Qiu W, Hu X, Colello J, Zheng SG, Lu Z. Functional Dynamics of Neutrophils After Ischemic Stroke. Transl Stroke Res. 2020;11:108–21. - PMC - PubMed
    1. Singh V, Roth S, Llovera G, Sadler R, Garzetti D, Stecher B, Dichgans M, Liesz A. Microbiota Dysbiosis Controls the Neuroinflammatory Response after Stroke. J Neurosci. 2016;36:7428–40. - PMC - PubMed
    1. Berer K, Gerdes LA, Cekanaviciute E, Jia X, Xiao L, Xia Z, Liu C, Klotz L, Stauffer U, Baranzini SE, et al. Gut microbiota from multiple sclerosis patients enables spontaneous autoimmune encephalomyelitis in mice. Proc Natl Acad Sci U S A. 2017;114:10719–24. - PMC - PubMed

LinkOut - more resources