

Lipidomic profiling of the cerebrospinal fluid in moyamoya angiopathy patients
- PMID: 40410905
- PMCID: PMC12101001
- DOI: 10.1186/s13023-025-03782-5
Lipidomic profiling of the cerebrospinal fluid in moyamoya angiopathy patients
Abstract
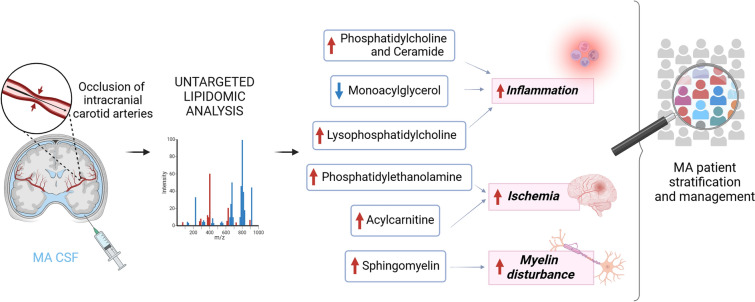
Background: Moyamoya angiopathy (MA) is a rare cerebrovascular disorder which can occur in both children and young adults, characterized by progressive occlusion of the intracranial carotid arteries, leading patients to ischemic and haemorrhagic strokes. Despite decades of research, the mechanisms underlying MA remain poorly clarified and current gaps in the understanding of pathogenesis have hampered the development of suitable preventive strategies and therapeutic options. Moreover, clinically approved biomarkers for MA patients' stratification are missing. The unknown pathophysiology and the lack of reliable biomarkers prompted us to investigate cerebrospinal fluid (CSF) lipidome through state-of-the-art lipidomics.
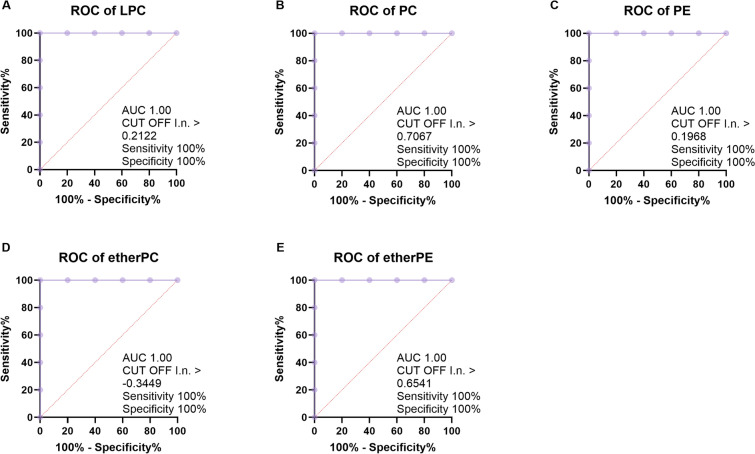
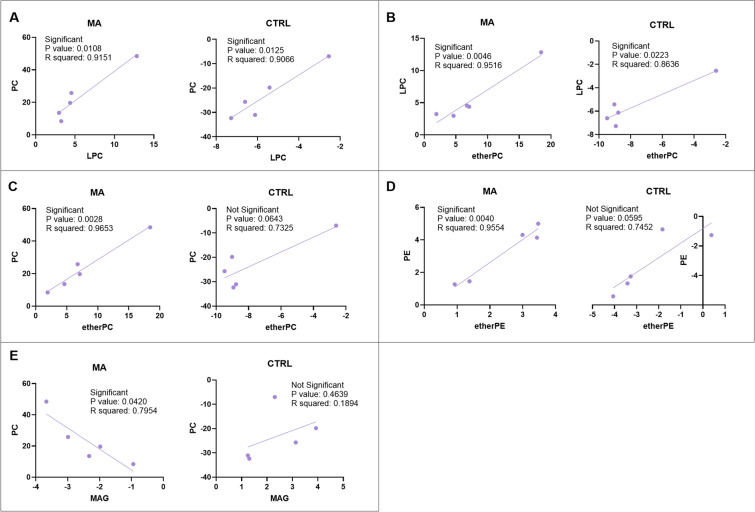
Methods: Intraoperative CSF from a subgroup of MA patients in comparison to age/sex matched controls (CTRL) was analysed through LC-MS/MS, by an untargeted lipidomic approach. Receiver operating characteristic (ROC) curve and simple linear regression analyses were performed for diagnostic use. We searched for simultaneously altered lipids in plasma and CSF of MA patients.
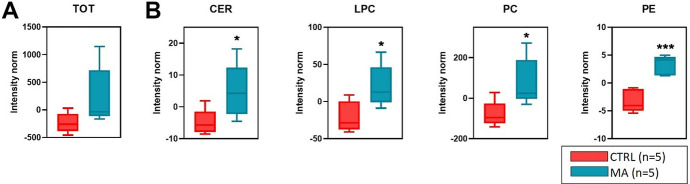
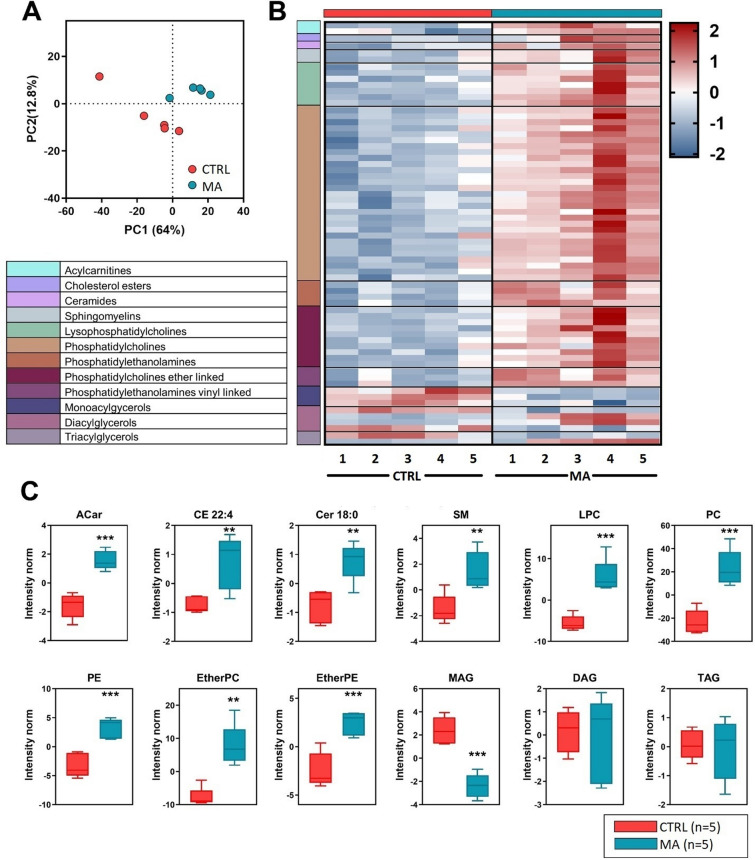
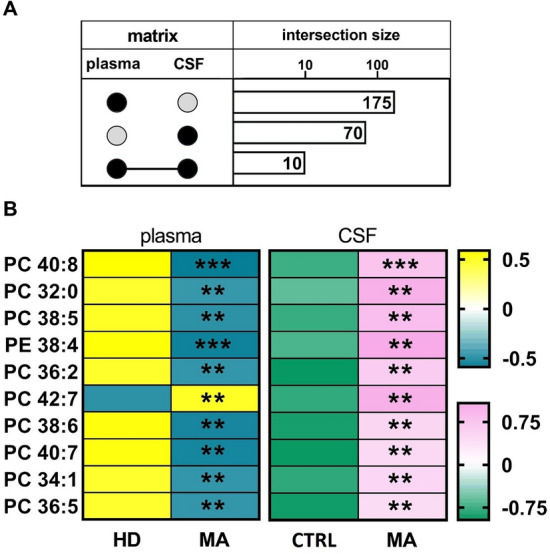
Results: Overall, we observed a significant increase of sphingolipids (p < 0.05) and phospholipids (p < 0.05) in MA CSF. A partial least squares discriminant analysis clearly separated MA and CTRL by 64% on Principal Component 1. We identified lipid classes (n = 12) with a Variance Importance in Projection score ≥ 1.5, within those lipids highly correlated with MA (n = 70). A significant increase in acylcarnitines, sphingolipids (sphingomyelins and ceramides), phospholipids (lysophosphatidylcholines; phosphatidylcholines; phosphatidylethanolamines; ether-phosphatidylethanolamines; ether-phosphatidylcholines) and cholesterol esters was found by multivariate and univariate analyses. Monoacylglycerols were the only lipid class displaying a markedly significant (p < 0.001) decrease in CSF of MA patients as compared to CTRL subjects. The ROC curve and simple linear regression analysis identified 10 out of 12 lipid classes as reliable MA biomarkers, mainly dealing with phospholipids. We then compared current and previous data on plasma lipidomic profile. The discriminant analysis returned n = 175 (in plasma) and n = 70 (in CSF) simultaneously altered lipids respectively, and phosphatidylcholines (n = 10) resulted as commonly decreased in plasma and increased in CSF.
Conclusions: Our findings highlighted a strong pro-inflammatory environment in MA CSF. These preliminary hallmarks could be helpful to decipher the complex MA pathogenesis, by supplying candidate biomarkers for patient stratification.
Keywords: CSF; Inflammation; Lipidomics; Moyamoya; Phosphatidylcholines; Phospholipids; Plasma; Sphingolipids.
© 2025. The Author(s).
Conflict of interest statement
Declarations. Ethics approval and consent to participate: The study design was approved by the Ethics Committee of the Fondazione IRCCS Istituto Neurologico “C. Besta” of Milan (GEN-O-MA clinical study, report no. 12, 10/01/2014). Informed written consent for study participation and sample collection from all patients and controls were mandatory for study inclusion. Consent for publication: Written informed consent was obtained from the individuals for the publication of any potentially identifiable images or data included in this article. Privacy procedures were applied to protect patients’ and control subjects’ personal identities. Competing interests: Not applicable.
Figures
Similar articles
-
Angiopoietin-2 associates with poor prognosis in Moyamoya angiopathy.Ann Clin Transl Neurol. 2024 Jun;11(6):1590-1603. doi: 10.1002/acn3.52076. Epub 2024 Apr 24. Ann Clin Transl Neurol. 2024. PMID: 38655722 Free PMC article.
-
Plasma Lipid Profiling Contributes to Untangle the Complexity of Moyamoya Arteriopathy.Int J Mol Sci. 2021 Dec 14;22(24):13410. doi: 10.3390/ijms222413410. Int J Mol Sci. 2021. PMID: 34948203 Free PMC article.
-
In-depth cerebrovascular lipidomics profiling for discovering novel biomarkers and mechanisms in moyamoya and intracranial atherosclerotic disease.Int J Surg. 2025 Jan 1;111(1):1607-1613. doi: 10.1097/JS9.0000000000002092. Int J Surg. 2025. PMID: 39352103 Free PMC article.
-
Plasma lipidomics in subjects with combat posttraumatic stress disorder.Free Radic Biol Med. 2022 Aug 20;189:169-177. doi: 10.1016/j.freeradbiomed.2022.07.012. Epub 2022 Jul 31. Free Radic Biol Med. 2022. PMID: 35918015
-
Identification of disease markers in human cerebrospinal fluid using lipidomic and proteomic methods.Dis Markers. 2006;22(1-2):39-64. doi: 10.1155/2006/202938. Dis Markers. 2006. PMID: 16410651 Free PMC article. Review.
References
-
- Shang S, Zhou D, Ya J, Li S, Yang Q, Ding Y, et al. Progress in moyamoya disease. Neurosurg Rev. 2020;43(2):371–82. 10.1007/s10143-018-0994-5. - PubMed
-
- Kobayashi E, Saeki N, Oishi H, Hirai S, Yamaura A. Long-term natural history of hemorrhagic moyamoya disease in 42 patients. J Neurosurg. 2000;93(6):976–80. 10.3171/jns.2000.93.6.0976. - PubMed
-
- Mejia-Munne JC, Ellis JA, Feldstein NA, Meyers PM, Connolly ES. Moyamoya and inflammation. World Neurosurg. 2017;100:575–8. 10.1016/j.wneu.2017.01.012. - PubMed
