. 2025 Sep;19(9):2574-2593.
doi: 10.1002/1878-0261.70051. Epub 2025 May 24.

Systematic profiling of cancer-fibroblast interactions reveals drug combinations in ovarian cancer

Affiliations

Systematic profiling of cancer-fibroblast interactions reveals drug combinations in ovarian cancer

Greta Gudoityte et al. Mol Oncol. 2025 Sep.

Abstract

Ovarian cancer (OC) is a leading cause of death of gynecological cancers in women. Poor patient response to treatment highlights the need to better understand how the tumor microenvironment affects OC progression. Growing evidence indicates the crucial role of non-cancerous components, such as cancer-associated fibroblasts, in establishing a complex network of cellular and molecular interactions, influencing cancer progression and response to treatment. Therefore, in this study, we sought to characterize the impact of fibroblasts on OC cell behavior and drug response. Using both direct and indirect cell co-culture systems, we observed distinct changes in cancer cell proliferation, morphology, and secretome in the presence of fibroblasts. Furthermore, an imaging-based high-throughput drug screen of 528 oncology compounds revealed multiple drugs that showed altered efficacy in the co-culture conditions, demonstrating the role of fibroblasts in driving cancer cell resistance to treatment. Most importantly, our data identified the two drug combinations of Birinapant or Vorinostat with Carboplatin as promising treatments, exploiting the altered cancer cell phenotype in co-cultures. These findings were supported by the increased sensitivity of ex vivo cultures to these combinations.

Keywords: cancer‐associated fibroblast; drug screen; ovarian cancer; tumor microenvironment.


Conflict of interest statement

OK is a board member and co‐founder for Sartar, advisor to the Knut and Alice Wallenberg Foundation, Novo Nordisk Foundation, and Sitra.

Figures

Fig. 1
Fig. 1
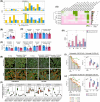
Cancer and fibroblast cell interactions alter cancer cell proliferation and morphology. (A) Schematic overview of the methods used in this study to characterize and study cancer and fibroblast interactions (Figure created with Biorender.com). (B) Fold change of cancer cell growth after 72 h in monoculture and co‐culture averaged for all fibroblast cultures at a 1 : 1 ratio. Data presented as mean ± SD (n = 8 for each condition), *P < 0.05 from Mann‐Whitney U test. (C) Comparison between direct co‐cultures (D‐CC) and indirect co‐cultures (I‐CC) fold change for cancer cells after 72 h in culture with the five different fibroblasts at a 1 : 1 ratio. (D) Representative images of OVSAHO cell morphology in monoculture (top), D‐CC (middle), I‐CC (bottom) panel, scale bar 200 μm (yellow is pre‐stained cancer cells, green is pre‐stained fibroblast cells, and turquoise is nuclear staining). (E) UMAP representation of the distribution of 318 morphological features extracted from the images of cancer cells under different culture conditions. Each cell line and culture condition are represented by the color scheme found in the figure legend. Each dot represents averaged cancer cell features per well, n = 4–8 replicates. (F) Comparison of normalized morphological features (n = 318) between monoculture and co‐culture conditions for each cancer cell line, averaged for all fibroblast co‐cultures (n = 4–8 for each condition). Data presented as mean of ± SD (n = 4–8 for each condition), *P < 0.05 from Mann–Whitney U test.
Fig. 2
Fig. 2
Cytokine profiling reveals differences between monocultures and co‐cultures. (A) UMAP plot of the secretory profile of monocultured and co‐cultured cells. Points are colored by culture condition according to legend; the light‐colored ellipses circles mark epithelial (red)/mesenchymal (green)‐like cancer cells in the plot. (B) Scatterplot highlighting differences in secretory profile between cancer and fibroblast cell monocultures for the 92 cytokines profiled. Each dot is the average normalized protein expression (NPX) for the cell population. (C) Boxplot showing cytokines with statistically significant differences between cancer and fibroblast monocultures, shown as scaled NPX (0 to 1), *P < 0.05 from Mann–Whitney U test. (D) Boxplot representing the differences of overall cytokine secretion between fibroblast models used in this study, shown as scaled NPX (0 to 1), *P < 0.05 from Mann–Whitney U test. (E) Scatterplot highlighting the secretory profile differences between non‐cancerous (NF) and patient‐derived (PDF) fibroblast monocultures, for the 92 cytokines profiled. Each dot is the average NPX for the cell population. (F) Boxplot showing differences of cytokine secretion between epithelial/mesenchymal‐like cancer cell monocultures, shown as scaled NPX (0 to 1), *P < 0.05 from Mann–Whitney U test. (G) Comparison of secretory profile between the two monocultures and co‐culture conditions, shown as scaled NPX (0 to 1), *P < 0.05 from Mann–Whitney U test. (H) Boxplot representing the most differentially secreted cytokines between co‐cultures and monocultures from both cell types, expressed as dualFC, *P < 0.05 from Mann–Whitney U test. (I) Boxplot representing drug sensitivity without and with WISP‐1 supplemented media.
Fig. 3
Fig. 3
Co‐culture screening reveals cancer cell resistance to drugs in presence of fibroblasts. (A) Drug response comparison between cancer cell monocultures and co‐cultures, expressed as drug sensitivity score (DSS), *P < 0.05 from Mann‐Whitney U test. (B) Distribution of drugs sensitizing differentially co‐cultures and monocultures, lines indicate selective DSS (sDSS) ± 2. (C) Comparison of drug response between both cancer monocultures and co‐cultures with BJHTERT and WI38 fibroblasts, *P < 0.05 from Mann–Whitney U test. (D) Comparison of BJHTERT and WI38 monoculture cytokine secretion levels, highlighting cytokines that are differentially secreted between the cells. (E) Drug subclasses exhibiting the most altered drug response depending on TME conditions, *P < 0.05 from Mann–Whitney U test. (F) Boxplot representing KURAMOCHI and OVCAR8 monoculture and co‐culture drug response to standard‐of‐care treatment.
Fig. 4
Fig. 4
Vorinostat and Birinapant in combination with Carboplatin show synergistic effects in cell co‐cultures and ex vivo spheroids. (A) A set of drugs that showed selective drug response to cancer cells of KURAMOCHI or OVCAR8 cells in co‐culture. Green rectangle marks Vorinostat, a drug that inhibited both tested cancer cell growth in co‐cultures. Subsequent validation experiment results, representing KURAMOCHI and OVCAR8 cancer cell response in monocultures and co‐cultures. Bars show mean viability after 72 h treatment, each dot represents biological and technical replicates (n = 9), *P < 0.05 from Mann–Whitney U test: (B) response to Carboplatin at 10000 nm concentration, (C) OVCAR8 response to Carboplatin, Vorinostat, Birinapant single drug treatment and their combination, (D) KURAMOCHI response to Carboplatin, Vorinostat, single drug treatment and their combination. (E) immunofluorescent images representing cell co‐cultures of cancer cell monocultures and co‐cultures with 030F, with and without treatment. Green in the images represents cancer cells, stained with CK8/18, and orange – fibroblasts stained with vimentin, blue – nuclei stained with Hoechst, scale bar 200 μm. (F) Morphological features of ex vivo spheroids generated from patient material, box plots indicate differences between each sample, dots represent technical replicates (n = 12), *P < 0.05 from Mann–Whitney U test. (G) Heatmap overview of patient ex vivo response to Vorinostat, Carboplatin, and Birinapant as single agents and combination treatments. Unsupervised sample hierarchical clustering performed using the Euclidean distance metric. The bar plot on the side represents the average of overall drug response. (H) Sample drug response comparison between the CA‐125 high and low level groups, dots represent each patient, *P < 0.05 from Mann‐Whitney U test. Here C corresponds to Carboplatin, V – Vorinostat, B – Birinapant. Sample drug response when treated with single drug and combinations. Bar on the left side represents each sample viability change when treated; bars indicate average values. While boxplots on the right represent the differences between CA‐125 high and low groups viability under treatment (n = 3), *P < 0.05 from Mann–Whitney U test: I – represents results after 100 000 nm Carboplatin and 10 000 nm Vorinostat drug treatment; J – represents results after 100 000 nm Carboplatin and 1000 nm Birinapant drug treatment. Here C corresponds to Carboplatin, V – Vorinostat, B – Birinapant.

References

    1. Matulonis UA, Sood AK, Fallowfield L, Howitt BE, Sehouli J, Karlan BY. Ovarian cancer. Nat Rev Dis Primers. 2016;2:16061. 10.1038/nrdp.2016.61 - DOI - PMC - PubMed
    1. Stewart C, Ralyea C, Lockwood S. Ovarian cancer: an integrated review. Semin Oncol Nurs. 2019;35:151–156. 10.1016/j.soncn.2019.02.001 - DOI - PubMed
    1. Mansur MB, Greaves M. Convergent TP53 loss and evolvability in cancer. BMC Ecol Evol. 2023;23:54. 10.1186/s12862-023-02146-6 - DOI - PMC - PubMed
    1. Luvero D, Milani A, Ledermann JA. Treatment options in recurrent ovarian cancer: latest evidence and clinical potential. Ther Adv Med Oncol. 2014;6:229–239. 10.1177/1758834014544121 - DOI - PMC - PubMed
    1. Colombo N, Sessa C, du Bois A, Ledermann J, McCluggage WG, McNeish I. ESMO–ESGO consensus conference recommendations on ovarian cancer: pathology and molecular biology, early and advanced stages, borderline tumours and recurrent disease. Ann Oncol. 2019;30(5):672–705. 10.1093/annonc/mdz062 - DOI - PubMed

MeSH terms

LinkOut - more resources