. 2025 Aug;12(30):e04418.
doi: 10.1002/advs.202504418. Epub 2025 May 24.

Multi-Omics and -Organ Insights into Energy Metabolic Adaptations in Early Sepsis Onset

Affiliations

Multi-Omics and -Organ Insights into Energy Metabolic Adaptations in Early Sepsis Onset

Lin-Lin Xu et al. Adv Sci (Weinh). 2025 Aug.

Abstract

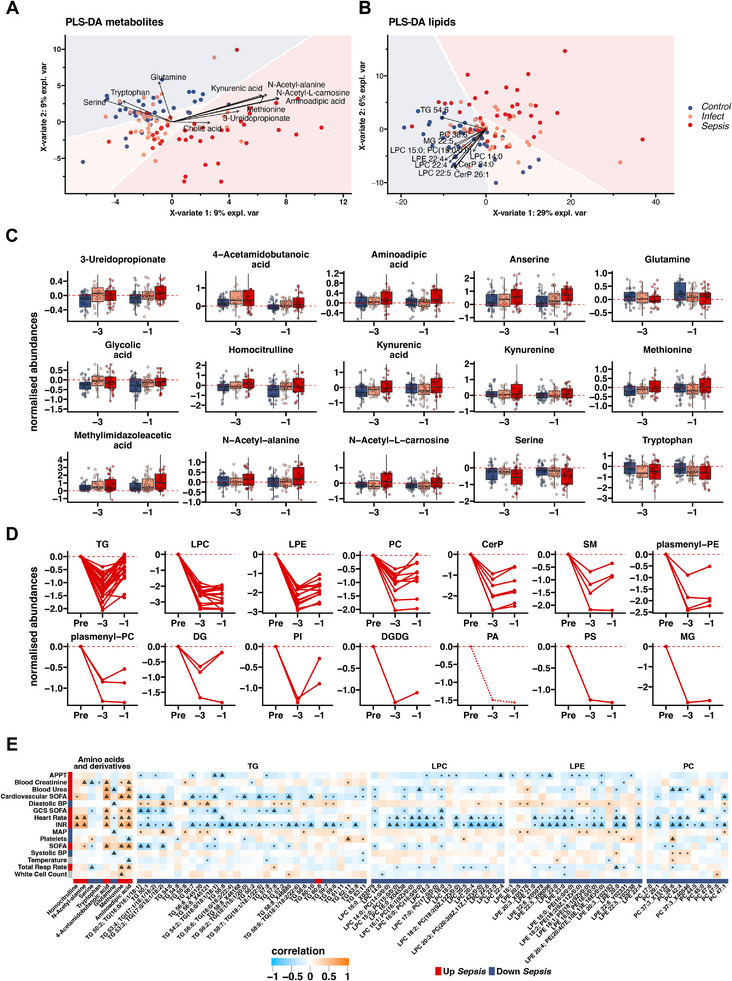
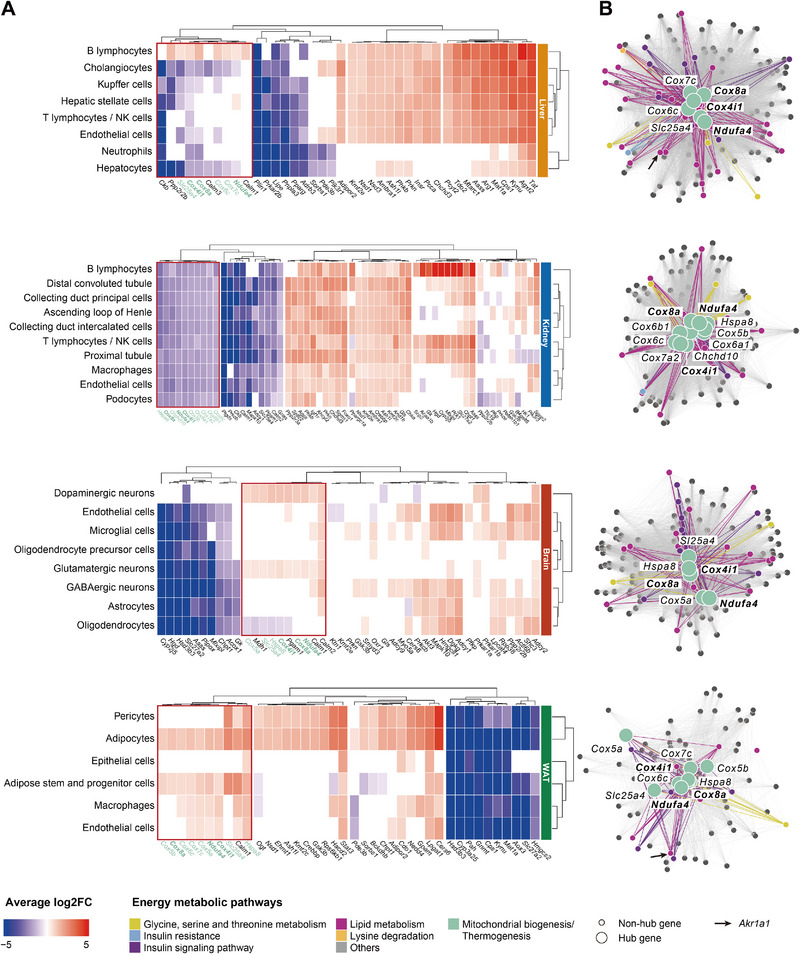
Systemic metabolic dysregulation in sepsis critically impacts patient survival. To better understand its onset, untargeted serum metabolomics and lipidomics are analyzed from 152 presymptomatic patients undergoing major elective surgery, and identified key metabolites, including serine and aminoadipic acid, that differentiate postoperative uncomplicated infection from sepsis. Using single-nucleus RNA sequencing data from an in vivo mouse model of sepsis, tissue-independent down-regulation and tissue-specific differences of serine and energy-related genes including key module roles for the mitochondria-linked genes, Cox4i1, Cox8a, and Ndufa4 are identified. Finally, serine-dependent metabolic shifts, especially in the liver, are revealed by using 12C/13C murine data with labeled serine, and link altered activity of the serine hydroxymethyltransferase (SHMT) cycle with perturbed purine metabolism during sepsis. This study demonstrates the close interrelationship between early metabolite changes and mitochondrial dysfunction in sepsis, improves the understanding of the underlying pathophysiology, and highlights metabolic targets to prospectively treat presymptomatic, but at-risk, patients.

Keywords: cell–cell communication; energy imbalance; lipid metabolism; metabolic modeling; sepsis biomarkers; single‐nucleus RNA sequencing (snRNA‐Seq).


Conflict of interest statement

M.S. received grants from NewB, Apollo Therapeutics, and UCL Technology Fund and others from Abbott, Amormed, bioMérieux, Biotest, Deltex Medical, Fresenius, Mindray, NewB, Pfizer, Radiometer, Roche Diagnostics, Safeguard Biosystems, Shionogi, and Spiden outside of this project. M.S. is an unpaid advisor to Presymptom Health Ltd, hemotune, deepUll, and Santersus, and R.L. is a part‐time advisor to Presymptom Health Ltd.

Figures

Figure 1
Figure 1
Infection‐specific metabolomics and lipidomics using presymptomatic serum samples from elective surgery patients. A) Study design. Serum samples were retrieved from 75 patients preoperatively (Pre) and 3 to 1 day(s) before clinical diagnosis of postoperative infection (39 developing Sepsis and 36 with uncomplicated Infect status). The patients were matched with 77 patients with no postoperative infection (38 Control and 39 SIRS). In total 455 samples were processed for untargeted metabolomics (n = 2086) and lipidomics (n = 5489) together with 26 tracked clinical parameters. Infect: uncomplicated postoperative infection; SIRS: systemic inflammatory response. Created with Biorender.com. B,C) Visualization of metabolomics/lipidomics data following Partial Least‐Squares Discriminant Analysis (PLS‐DA). Clinical parameters are indicated by individual arrows. Inf+/Inf‐: Patients with/without postoperative infection. D,E) Volcano plot of logistic regression models with covariates age, sex, and organ dysfunction status built separately with each metabolite (D) or lipid (E) to differentiate the groups infection (Inf+) from no infection (Inf‐). Metabolites and lipids with raw P‐value ≤ 0.05 are named and colored according to their HMDB and Lipid Map subclass. F) Multiscale embedded correlation network analysis illustrating the differential correlation of lipids and changes in lipid metabolic pathways in presymptomatic samples associated to Inf‐ versus Inf+ postoperative outcome. Only lipid pairs with significant differential correlations (adjusted empirical p ≤ 0.01) were included. Sign/sign in the legend indicates the direction and strength of correlation change in Inf‐/Inf+ followed by the number of associated significant correlation changes. For instance, “++/+ 111″ indicates 111 lipid pairs correlate significantly stronger positive (++) in Inf‐ than in Inf+ (+). One module of biological interest with Diglyceride (DG) 29:1 as hub was circled for better visual clarity (see Results for details). Hub nodes of further modules (not shown) are named and with a black border. Significant lipids shown in (E) are indicated by a red border. APPT: activated partial thromboplastin time; SOFA: Sequential Organ Failure Assessment score; BP: blood pressure; GCS: Glasgow Coma Scale; INR: international normalized ratio; MAP: mean arterial pressure; Total Resp Rate: total respiratory rate; CRP: C‐Reactive Protein. TG: triglyceride; LPC: lysophosphatidylcholine; LPE: lysophosphatidylethanolamine; PC: phosphatidylcholine; Cerp: ceramide phosphate; SM: sphingomyeline; PE: phosphatidylethanolamine; DG: diglyceride; PI: phosphatidylinositol; DGDG: digalactosyldiacylglycerol; PA: phosphatidic acid; PS: phosphatidylserine; MG: monoacylglycerol; FA: fatty acid.
Figure 2
Figure 2
Presymptomatic severity trend analysis from Control to septic postoperative outcome. A,B) Visualization of PLS‐DA using metabolite (A) or lipid (B) data with different postoperative outcome. The top 10 most influential metabolites and lipids are indicated by individual arrows. C,D) Ordinal regression models with covariates age and sex for each metabolite and lipid with unadjusted p‐value ≤ 0.05 and false discovery rate (FDR) ≤ 0.25 of the disease severity trends from Control over Infect (uncomplicated infection) to Sepsis within 3 days and 1 day before diagnosis. Displayed abundances are normalized to preoperation abundances. (C) Significant metabolites in the Control (blue), Infect (orange), and Sepsis (red) group. D) Significant lipids in the Sepsis group were grouped by their name and present the change from preoperation to 1 day before (postoperative) diagnosis. Solid and dashed lines indicate higher and lower abundances (normalized by preoperative abundance) in the Control compared to the Sepsis group, respectively (compare Figure S2). E) Partial Spearman correlation analysis of significantly altered compounds from Figures (C), (D) together with clinical parameters in the Sepsis group. Significance of correlation is indicated by black circles (un‐adjusted P ≤ 0.05) and triangles (FDR ≤ 0.05). Annotation bars indicate increasing (red, Up Sepsis) and decreasing (blue, Down Sepsis) severity of infection as tested by ordinal regression models (compounds) and based on literature review (clinical data). APPT: activated partial thromboplastin time; SOFA: Sequential Organ Failure Assessment score; BP: blood pressure; GCS: Glasgow Coma Scale; INR: international normalized ratio; MAP: mean arterial pressure; Total Resp Rate: total respiratory rate. TG: triglyceride; LPC: lysophosphatidylcholine; LPE: lysophosphatidylethanolamine; PC: phosphatidylcholine; Cerp: ceramide phosphate; SM: sphingomyeline; PE: phosphatidylethanolamine; DG:.
Figure 3
Figure 3
A CLP‐induced septic mouse model recaptures human sepsis signature compounds. A) Statistical analysis for CLP versus sham mice samples of metabolites and lipids associated to Sepsis signature compounds identified in the presymptomatic human cohort. Significance according to two‐tailed Student's t‐test (circle: unadjusted p‐value ≤ 0.05, triangle: FDR ≤ 0.25). Significance of human serum samples (Figure 2C,D) is additionally indicated for easier comparison. B) Fast expectation‐maximization microbial source tracking (FEAST) results show the estimated contribution of five tissues (“source”) on the serum (“sink”) based on all metabolites and lipids composition for each mouse (two septic, CLP1/2, and three control, sham1/2/3, mice). C) Absolute number and fraction of human sepsis signature compounds also detected in mice serum and five tissues. D) Multiscale embedded correlation network analysis illustrating the differential correlation of metabolites and lipids in sham relative to CLP. Only correlation pairs with significant differential correlations (adjusted empirical P ≤ 0.05) were included. Sign/sign indicates the direction and strength of correlation changes in sham/CLP followed by the number of associated lipid pairs with this change. Two identified modules are circled for clarity (compare Results). Module hub nodes have a black border, while nodes with red labels are compounds that significantly correlated with SOFA score in the human cohort (Figure S2B). Abbreviations: LPC: lysophosphatidylcholine; LPE: lysophosphatidylethanolamine; PC: phosphatidylcholine; DG: diglyceride; PI: phosphatidylinositol; TG: triglyceride; WAT: white adipose tissue.
Figure 4
Figure 4
Single cell mouse RNA sequencing driven Compass analysis to identify tissue‐ and cell type‐specific metabolic activity. A) Single‐nucleus RNA sequencing (snRNA‐Seq) design. Triplicates of sham and CLP mice were sacrificed 24 h after operation. Tissue samples of brain, liver, kidney and WAT were collected and yielded between 43347 and 50929 cells in total per tissue. Created with Biorender.com. B) Cohen's d effect size distribution for four energy relevant pathways. Effect sizes by Cohen's d comparing CLP versus sham per pathway associated reaction as defined in the human genome‐scale metabolic model RECON2 across all cell types associated to a given tissue. Different grey background areas reflect different effect sizes. Only reactions with significant changes for CLP versus sham (two‐sided Wilcoxon test, FDR adjusted p ≤ 0.05) were considered. C) Volcano plot for reactions associated to the pathways shown in (B). Y axis shows significance following two‐sided Wilcoxon test of the change CLP versus sham per reaction (FDR adjusted p ≤ 0.05). The top 5 reactions with highest effect change and EC classification number per pathway are indicated. D) Contextualized metabolic network information for highlighted reactions shown in (C). Metabolic network was adapted from the KEGG pathways (https://www.genome.jp/kegg/) hsa00310 (Lysine degradation), hsa00561 (Glycerolipid metabolism), hsa00564 (Glycerophospholipid metabolism) and hsa00260 (Glycine, serine and threonine metabolism). Abbreviations: Gly, ser, ala & thr mb: Glycine, serine and threonine metabolism; Lys mb: Lysine metabolism, Glycerophospholipid mb: Glycerophospholipid metabolism. X‐axis labels sham and CLP reflect direction of change of calculated effect sizes. EC numbers: 1.1.1.95: Phosphoglycerate dehydrogenase; 1.1.99.1: Choline dehydrogenase; 1.2.1.31: Aminoadipate semialdehyde dehydrogenase; 1.5.1.10: Saccharopine dehydrogenase; 1.5.1.8: Saccharopine dehydrogenase (NADP+, L‐lysine‐forming); 1.5.1.9: Saccharopine dehydrogenase (NAD+, L‐glutamate‐forming); 1.5.3.7: L‐pipecolate oxidase; 1.5.99.2: Dimethylglycine dehydrogenase; 2.1.1.17: Phosphatidylethanolamine N‐methyltransferase; 2.1.1.20: Glycine N‐methyltransferase; 2.1.1.5: Betaine‐homocysteine S‐methyltransferase; 2.3.1.15: Glycerol‐3‐phosphate acyltransferase; 2.3.1.51: Lysophosphatidic acid‐acyltransferase; 2.3.1.61: Dihydrolipoamide succinyltransferase; 2.6.1.39: 2‐aminoadipate transaminase; 2.6.1.51: L‐Serine:pyruvate aminotransferase; 2.6.1.52: Phosphoserine transaminase; 2.7.1.107: Diacylglycerol phosphate kinase; 2.7.7.15: Choline phosphate phosphatase; 2.7.7.41: Phosphatidate cytidylyltransferase; 2.7.8.11: Phosphatidylinositol synthase; 3.1.1.23: Acylglycerol lipase; 3.1.1.3: Triacylglycerol lipase; 3.1.3.3: Phosphoserine phosphatase; 3.1.3.4: Phosphatidic acid phosphatase.
Figure 5
Figure 5
Mouse tissue‐ and cell type‐Specific gene regulation of energy metabolic pathways in CLP‐induced sepsis. A) Principal component analysis (PCA) based on the average gene expression profiles of energy metabolic genes in the four tissues. Axes reflect the first two principal components (PC1, PC2) and their explained variance. B) Cell‐cell communication of genes belonging to the 34 energy‐related pathways based on the KEGG database in different cell types of the four tissues. Numbers in the tissue label indicate the number of energy‐related gene‐gene interactions for CLP versus sham. Linkages connecting the key metabolic cell types of hepatocytes, proximal tubule, neurons, and adipocytes are highlighted by saturated color. Red and blue linkage colors indicate more interaction pairs in CLP or sham, respectively. Linkage width is associated with the number of observed interactions between any two connected cell types. C) Number of differentially expressed genes (DEGs) between CLP and sham in the four tissues. Red and blue represent up‐ and down‐regulated genes in CLP and sham, respectively. D) Average log2(fold‐change) profile of the 37 DEGs with consistent variation direction across four tissues at the cell type level between CLP and sham. Red and blue colors indicate upregulated genes in CLP and sham, respectively.
Figure 6
Figure 6
Gene co‐expression networks associated with energy metabolism and hub genes in mouse CLP‐induced sepsis. A) Average log2(fold‐change) profile of the hub genes in all modules per tissue for CLP versus sham. Red and blue colors indicate up‐ and down‐regulated genes in CLP, respectively. The structurally common module across all four tissues is indicated by a red border. Hub genes belonging to the mitochondrial biogenesis/thermogenesis pathway are highlighted in green, within which the three common genes across tissues are in bold font. B) Co‐expression networks based on energy metabolism associated genes in the common module per tissue. Each node represents one gene, and each edge refers to the co‐expression relationship between two connected nodes. Node color reflects pathway association. Nodes of hub genes belonging to mitochondrial biogenesis/thermogenesis are enlarged and labeled with gene symbols. Colored linkages indicate the pathway origin of genes linked with mitochondrial biogenesis/thermogenesis hub genes. The three hub genes Cox4i1, Cox8a and Ndufa4 present in each tissue‐specific network are indicated in bold font. Akr1a1 was labeled with a black arrow in the liver and WAT.
Figure 7
Figure 7
Serine administration and serine labeling experiments reveal drop in hepatic PC and elevated serine integration into purines in early sepsis. A) Differential lipid abundance in Serine+ versus Vehicle (Serine‐) treated mice in both CLP and sham groups. Mean abundance is z‐scaled. B) Metabolites with significantly incorporated 13C‐labeled serine‐derived carbon in septic mice. Only metabolites with significant higher incorporation percentage in 13C CLP than 13C sham (one‐sided Student's t test, p ≤ 0.05, FDR adjusted p ≤ 0.25) and higher incorporation percentage in 13C CLP than 12C CLP (one‐sided Student's t test, FDR adjusted p ≤ 0.05) were considered. C) Schematic of purine metabolism in mice liver in context of tissue specific gene expression profile based on snRNA data. Metabolic network was adapted from the KEGG pathways (https://www.genome.jp/kegg/) mmu00260 (Glycine, serine and threonine metabolism) and mmu00230 (Purine metabolism). All cell types shown next to genes indicated up‐regulated gene expression in these cells in liver of septic compared to sham mice. Created with Biorender.com. D) Violin plot of nine genes in purine metabolism shown in (C). * p ≤ 0.05; ** p ≤ 0.01; *** p ≤ 0.001. LPC: lysophosphatidylcholine; LPE: lysophosphatidylethanolamine; PC: phosphatidylcholine; DG: diglyceride; PI: phosphatidylinositol; PS: phosphatidylserine.

Similar articles

References

    1. Singer M., Deutschman C. S., Seymour C., Shankar‐Hari M., Annane D., Bauer M., Bellomo R., Bernard G. R., Chiche J. D., Coopersmith C. M., Hotchkiss R. S., Levy M. M., Marshall J. C., Martin G. S., Opal S. M., Rubenfeld G. D., Poll T. D., Vincent J. L., Angus D. C., J. Am. Med. Assoc. 2016, 315, 801.
    1. Rudd K. E., Johnson S. C., Agesa K. M., Shackelford K. A., Tsoi D., Kievlan D. R., Colombara D. V., Ikuta K. S., Kissoon N., Finfer S., Fleischmann‐Struzek C., Machado F. R., Reinhart K. K., Rowan K., Seymour C. W., Watson R. S., West T. E., Marinho F., Hay S. I., Lozano R., Lopez A. D., Angus D. C., Murray C. J. L., Naghavi M., Lancet 2020, 395, 200. - PMC - PubMed
    1. Evans L., Rhodes A., Alhazzani W., Antonelli M., Coopersmith C. M., French C., Machado F. R., Mcintyre L., Ostermann M., Prescott H. C., Schorr C., Simpson S., Wiersinga W. J., Alshamsi F., Angus D. C., Arabi Y., Azevedo L., Beale R., Beilman G., Belley‐Cote E., Burry L., Cecconi M., Centofanti J., Coz Yataco A., De Waele J., Dellinger R. P., Doi K., Du B., Estenssoro E., Ferrer R., et al., Intens. Care Med. 2021, 47, 1181. - PMC - PubMed
    1. Giamarellos‐Bourboulis E. J., Aschenbrenner A. C., Bauer M., Bock C., Calandra T., Gat‐Viks I., Kyriazopoulou E., Lupse M., Monneret G., Pickkers P., Schultze J. L., van der Poll T., van de Veerdonk F. L., Vlaar A. P. J., Weis S., Wiersinga W. J., Netea M. G., Nat. Immunol. 2024, 25, 19. - PubMed
    1. Siddiqui M. A., Pandey S., Azim A., Sinha N., Siddiqui M. H., Biophys. Chem. 2020, 267, 106462. - PMC - PubMed

LinkOut - more resources