. 2025 Jun;34(6):e70145.
doi: 10.1002/pro.70145.

Synthetic antibodies targeting EphA2 induce diverse signaling-competent clusters with differential activation

Affiliations

Synthetic antibodies targeting EphA2 induce diverse signaling-competent clusters with differential activation

Jarrett J Adams et al. Protein Sci. 2025 Jun.

Abstract

The receptor tyrosine kinase EphA2 interacts with ephrin (Efn) ligands to mediate bi-directional signals that drive cellular sorting processes during tissue development. In the context of various cancers, EphA2 can also drive invasive metastatic disease and represents an important target for cancer therapeutics. Natural Efn ligands sterically seed intertwined EphA2 clusters capable of recruiting intracellular kinases to mediate trans-phosphorylation. Synthetic proteins, such as antibodies (Abs), can mimic Efn ligands to trigger EphA2 signaling, leading to receptor internalization and degradation, and enabling intracellular delivery of conjugated drugs. Furthermore, Abs are capable of recruiting EphA2 into clusters distinct from those seeded by Efn. We developed three synthetic Abs targeting distinct EphA2 domains and determined the paratope valency necessary for agonist or antagonist properties of each of the three epitopes. Structural modeling of monovalent Fabs in complex with EphA2 elucidated competitive and non-competitive mechanisms of inhibition of EphA2 canonical signaling. Likewise, modeling of clusters induced by bivalent IgGs elucidated multiple signaling-competent EphA2 clusters capable of triggering a continuum of signaling strengths and provided insights into the requirement for multimerization of EphA2 to trigger phosphorylation. Our study shows how different agonist clusters lead to distinct kinase recruitment efficiencies to modify phosphotyrosine signal strength, and provides a panel of anti-EphA2 Abs as reagents for the development of therapeutics.

Keywords: Efn; Eph; EphA2; antibody; mechanism; phage display; receptor clustering; receptor tyrosine kinase; signaling.


Conflict of interest statement

The authors declare no conflicting interests.

Figures

FIGURE 1
FIGURE 1
Interfaces in EphA2 clusters. (a) Surface rendering of EphA2 clusters derived from the apo EphA2 extracellular domain (ECD) complex (protein data bank (PDB) entry 3FL7, left) and the EphA2‐EfnA5 complex (PDB entry 2X11, right). Domains of EphA2 (ligand‐binding domain (LBD), blue; cysteine‐rich domain (CRD), green; N‐terminal fibronectin‐3 domain (FN1), purple; C‐terminal fibronectin‐3 domain (FN2), red) and EfnA5 (cyan) are illustrated as tetrameric chain‐link clusters. For the 2X11 cluster, trans‐engaging receptors and cis‐engaging EfnA5 are illustrated as ribbons without surfaces. Distances between C‐termini approximating transmembrane (TM) distance of clustered receptors within the tetramer are indicated (dashed arrows). (b) Ribbon rendering of the “closed” dimer mediated by LL and CC interfaces (left) or LL′ interfaces (right) with interface contacts atoms (<4.5 Å) between EphA2 protomers shown as orange spheres. Distances between C‐termini approximating TM distance within the dimer are indicated (dashed arrows). (c) Ribbon rendering of the “open” dimer through CC/FN1 (left) or LL′ interfaces (right) with interface contact residues (<4.5 Å) between EphA2 protomers shown as orange spheres. Distances between C‐termini approximating TM distance within the dimer are indicated (dashed arrows). (d) Ribbon rendering of trans‐zippered EphA2. EfnA5 associates with high affinity to the LBD (Site 1) and forms anti‐parallel interactions with adjacent protomers of EphA2 through the FN1 and FN2 domains (Site 2). Interface contact residues (<4.5 Å) between EphA2 and EfnA5 protomers are shown as pink spheres for Site 1 and orange spheres for Site 2. Distances between C‐termini approximating distance within the head‐to‐tail dimer are indicated (dashed arrows). (e) Summary table of observed interfaces for each crystal structure of EphA2 in either apo or ephrin (Efn) bound forms. Interfaces between adjacent protomers made through the LBD (LL and LL′), CRD (CC) or to Efn (Site 1 and Site 2) are annotated as observed (+) or absent (−) in each unit cell (PDB entries 2X10, 3FL7, 3MBW, 3MX0, and 2X11). Structures of EphA2 where dimer interfaces are not possible are denoted as not applicable (N/A).
FIGURE 2
FIGURE 2
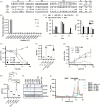
Functional characterization of anti‐EphA2 antibodies (Abs). (a) Complementarity‐determining region (CDR) sequences of anti‐EphA2 antigen‐binding fragments (Fabs). Sequences are shown for positions that were diversified in the phage library and are numbered according to the international ImMunoGeneTics (IMGT) information system nomenclature (Lefranc, 2014). Kinetic binding constants for Fabs binding to immobilized EphA2 extracellular domain (ECD) were determined by surface plasmon resonance and are shown on the right. (b) Specificity of IgGs assessed with a panel of ECDs from the 14 human erythropoietin‐producing hepatocellular (Eph) receptor family members. Steady‐state biolayer interferometry was used with each immobilized Eph ECD (x‐axis) to measure the binding of 100 nM IgG, and binding signal was normalized to the signal for immobilized EphA2 and Fc (y‐axis). (c) Specificity of 100 nM Fabs assessed by enzyme‐linked immunosorbent assay (ELISA) with immobilized domain fragments of EphA2. Fab F1′ refers to the parental Fab raised from Library F before optimization (Enderle et al., 2021). (d) Flow cytometry of BxPC3 tumor cells treated with 100 nM Ab L1, C1 or F1 in the Fab (white) or IgG format (black). The fold median fluorescence signal relative to secondary alone is plotted (n = 2). (e) Effects of Fabs (x‐axis) on phosphorylated EphA2 (pEphA2) levels in BxPC3 cells stimulated with EfnA1‐Fc‐IgG, assessed by quantitative ELISA detection of EphA2 pTyr588 (y‐axis). (f) Maximum inhibition levels of pEphA2 plotted as a bar graph with individual replicates illustrated by dots for antagonistic Fabs. Statistical analysis was carried out using analysis of variance (ANOVA) (n ≥ 3) in Prism GraphPad where **** indicates p < 0.0001. (g) Effects of IgGs (x‐axis) on pEphA2 levels in BxPC3 cells, assessed by quantitative ELISA detection of EphA2 pTyr588 (y‐axis). Activation was fit using linear regression (solid line) or trend line if “hooked” (dashed) due to saturation‐dependent loss of activity. (h) Statistical evaluation of maximum activation levels of pEphA2 plotted as a bar graph with individual replicates illustrated by dots for agonist IgGs (left). Statistical analysis was carried out using ANOVA (n ≥ 3) in Prism GraphPad. Significant differences in maximal agonist activation were observed for IgGs L1 and C1 (ANOVA, p < 0.05). Statistical analysis was carried out by ANOVA where ns (no significance) indicates p > 0.05, * indicates p < 0.05, and *** indicates p < 0.001. (i) Phospho‐specific western analysis of pEphA2 in response to saturating concentrations of Ab agonists (100 nM) in BxPC3 cells. Blots were probed for juxtamembrane‐pTyr588, kinase‐pTyr772 and kinase‐pS897signal in response to 15 min of ligand stimuli in conditioned media. (j) Size exclusion chromatograpy of clusters induced by EphA2 IgGs (200 nM) or diabody‐Fc‐Fab F1 (100 nM) and EfnA1‐Fc (200 nM) bound to EphA2 (500 nM) separated on Superose 6 10/300 column. Peak volumes of standard molecular weight proteins are indicated (gray). Intermediate complexes ≤660 kDa and high molecular weight complexes are indicated. CRD, cysteine‐rich domain; LBD, ligand‐binding domain.
FIGURE 3
FIGURE 3
Structures of antigen‐binding fragments (Fabs) in complex with EphA2 domains. (a) Structures of Fabs L1, C1, and F1 in complex with EphA2 ligand‐binding domain (LBD) (left), cysteine‐rich domain (CRD) (middle), or C‐terminal fibronectin‐3 domain (FN2) (right), respectively. The main chains are shown as ribbons colored as follows: EphA2, gray; Fab heavy chain (HC), blue; Fab light chain (LC), green. (b) Superposition of the three Fab:EphA2‐domain structures with the structure of the full‐length EphA2 extracellular domain (ECD) (protein data bank (PDB) entry 3FL7). A single EphA2 ECD monomer is shown as a surface colored as follows: LBD, blue; CRD, green; N‐terminal fibronectin‐3 domain (FN1), purple; FN2, red. Fabs are shown as ribbons colored as follows: L1, light blue; C1, light green; F1, light red. (c) Intermolecular interfaces mapped onto the structure of the EphA2 ECD (PDB entry 2X11). The EphA2 ECD is shown as a gray surface, except regions involved in intermolecular interactions, which are shown in distinct colors. Regions that interact only with other EphA2 ECDs, EfnA5 ligand, or Fabs are colored green, cyan, or yellow, respectively. Regions that interact with both EfnA5 and Fab L1 (N‐terminal region) or F1 (C‐terminal region) are colored red.
FIGURE 4
FIGURE 4
High affinity binding to the cysteine‐rich domain (CRD) and C‐terminal fibronectin‐3 domain (FN2) of EphA2. (a) Epitope contact residues (green) mapped on the sequence of the EphA2 CRD domain (K199‐P329). Disulfide bonds are illustrated with black lines. β‐Strand structure is illustrated as arrows. (b) Structure of antigen‐binding fragment (Fab) C1 (gray) bound to CRD (green) with the CC interface occupied by a second CRD protomer (yellow). Fab and CRD are illustrated as ribbons, and dimerized CRD is shown as a yellow surface. (c) Surface rendering of the CRD (green) with paratope residues of Fab C1 within 4.5 Å of the CRD illustrated as sticks and colored as follows: complementarity determining region (CDR)‐H1 (yellow), CDR‐H2 (orange), CDR‐H3 (red), CDR‐L1 (pink), CDR‐L2 (cyan), CDR‐L3 (purple), framework (white). (d) The hydrogen bond (dashed lines) network made between the paratope residues (CDRs colored as in c) and polar residues on the surface of the CRD (green) is illustrated for contact residues (sticks). (e) Antibody (Ab) paratope tables of CDRs for the C1 Ab. Residues with large contributions to the energetics of binding are bolded in green in the table. Residues observed in contact with EphA2 in distinct crystallized complexes are depicted (+). (f) Single point enzyme‐linked immunosorbent assay (ELISA) of Asp‐scanned paratope variants (100 nM) encompassing all observed contact residues to EphA2‐His (solid) or bovine serum albumin (BSA) (empty). Standard deviation n = 2. (g) Epitope contact residues (red) mapped on the sequence of the EphA2 FN2 (E438‐L527). β‐strand and α‐helical structures are illustrated as arrows or cylinders, respectively. (h) Structure of Fab F1 (gray ribbon) bound to FN2 (red) superimposed on the FN2 structure when bound to EfnA5 (pink, protein data bank (PDB) entry 2X11) or the apo state (yellow, PDB entry 3FL7). (i) Surface rendering of the four F1 Fabs (white) in complex with four FN2 domains (red ribbons) in the asymmetric unit (ASU) (left). Superimposed F1 Fab‐FN2 complexes (right). (j) Surface rendering of the FN2 (light pink) with paratope residues of Fab F1 within 4.5 Å of the CRD illustrated as sticks and colored as in (c). (k) Antibody paratope tables of CDRs for the F1 Ab. CDR‐H3 residues with large contributions to the energetics of binding are bolded in red in the table. Residues observed in contact with EphA2 in the crystallized complex are depicted (+). (l) Single point ELISA of Asp‐scanned CDR‐H3 variants (100 nM) binding to EphA2 (solid) or BSA (empty). Standard deviation n = 2.
FIGURE 5
FIGURE 5
Molecular basis for the absolute specificity of antibody (Ab) L1 for the EphA2 ligand‐binding domain (LBD). (a) Biolayer interferometry sensorgrams of 300 nM EphA2‐Fc (blue), EphA4‐Fc (red), or EphA8‐Fc (green) binding to immobilized IgG L1 (left) or 1C1 (right). (b) Structural alignments of the L1:LBD complex (yellow/blue) with the EfnA5:LBD (cyan/gray) and 1C1:LBD (pink/green) complexes superimposed. (c) Epitope contact residues to L1 (blue), 1C1 (green), or both (gray) mapped on the sequence of the EphA2 LBD. (d) Overlays of the following EphA2 structures: antigen‐binding fragment (Fab) L1:LBD‐cysteine‐rich domain (CRD) complex (blue), Fab 1C1:LBD complex (green, protein data bank (PDB) entry 3SKJ), apo LBD (dark gray, PDB entry 3C8X), and EfnA5:LBD complex (light gray, PDB entry 2X11). (e) Comparison of contact residues at the interfaces between the LBD (blue) and Fab L1 (gray, top) or LBD (green) and Fab 1C1 (gray, bottom). Contact residues (<4.5 Å) are shown as sticks on ribbons. Hydrogen bonds are shown as dashed lines. (f) Paratope table of complementarity determining regions (CDRs) for L1 Abs. Residues with large contributions to the energetics of binding are bolded in blue in the table. Residues observed in contact with EphA2 in distinct crystallized complexes are depicted (+). (g) Single point enzyme‐linked immunosorbent assay (ELISA) of Asp‐scanned paratope variants (100 nM) binding EphA2 (solid) or bovine serum albumin (BSA) (empty). Standard deviation n = 2.
FIGURE 6
FIGURE 6
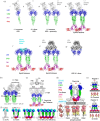
Activation of EphA2 through chain‐linked clusters. (a) Common receptor arrangements observed in crystal structures of EphA2 bound to agonist ligands. The structures of the 1:1L1:ligand‐binding domain (LBD)‐cysteine‐rich domain (CRD) (i), 1:2L1:LBD‐CRD (ii), 1:2L1:LBD‐CRD symmetrical dimer (iii), the L1 dimer superimposed onto the chain‐link cluster (protein data bank (PDB) entry 3FL7) (iv), the chain‐link cluster superimposed with EfnA5:EphA2 (PDB entry 3FL7/3MX0) (v), the chain‐linked cluster superimposed with the 1C1 symmetry dimer (PDB entry 3FL7/3SKJ) (vi) and the 1C1:LBD dimer (PDB entry 3SKJ) (vii) identified by analyzing symmetrically related molecules in the unit cell are shown as ribbons. Antigen‐binding fragments (Fabs) are illustrated as gray, ephrin (Efn) as cyan and the domains of EphA2 are illustrated as follows: ligand‐binding domain (LBD) (blue), cysteine‐rich domain (CRD) (green), N‐terminal fibronectin‐3 domain (FN1) (purple) and C‐terminal fibronectin‐3 domain (FN2) (red). (b) Surface rendering of the chain‐link cluster observed in the 1:2 complex of Fab L1:LBD‐CRD where the EphA2 fragments are dimerized in the asymmetric unit (ASU) by LL (blue) and CC (green) interfaces and interact through LL′ interfaces between symmetrically related molecules. (c) Surface rendering of human IgG (adapted from PDB entry 1HZH) with distance between Fabs annotated (top). Overlay of four L1 Fabs (representing two IgGs) onto the tetrameric chain‐link cluster of EphA2 observed in the apo complex (PDB entry 3FL7) (bottom). Surfaces are colored as follows: Fabs and IgGs (white), LBD (blue), CRD (green), FN1 (purple), and FN2 (red). (d) Profile surface rendering of EphA2 receptor clusters induced by IgG L1, using structures of the EphA2 extracellular domain (ECD) and intracellular domain (ICD) (PDB entries 3FL7 and 7KJA). ECDs of EphA2 that recruit proximal kinases are colored, whereas ECDs of clustered EphA2 that give rise to distal kinases are depicted in white. Domains of EphA2 are colored as indicated on the left. Domains responsible for LL (black) and LL′ (red) clustering are indicated in dashed boxes. Inset is a top‐down perspective of the ICDs alone. (e) Full receptor models of two potential tetramer registers recruited by L1 IgGs. Register 1 (top) and register 2 (bottom) EphA2 tetramers form distinct recruitment profiles for intracellular kinases, resulting in proximal or distal recruitment, respectively. Two L1 IgGs are illustrated as four Fab arms (white). (f) Profile surface renderings of chain‐link clusters of increasing size (left to right) with predicted efficiency of pTyr588 for each cluster shown below. Protomers resulting in distally recruited kinases are colored white. Efficiency percentages represent the fraction of kinases predicted to be phosphorylated per cluster size illustrated.
FIGURE 7
FIGURE 7
Uncoupling chain‐linked activation through constrained C‐terminal fibronectin‐3 domain (FN2) dynamics. (a) Superposition of F1:FN2 onto the LL/CC dimer (left) or the LL′ dimer (right) to evaluate steric clashes. (b) Superposition of F1:FN2 onto the chain‐link tetramer in register 1 (left) or register 2 (right) to evaluate steric clashes. Clashes are indicated with arrows. (c) Surface rendering of N‐terminal fibronectin‐3 domain (FN1)‐FN2 modular pair (adapted from protein data bank (PDB) entry 2X11) (left). FN1 (purple) and FN2 (red) are linked by a flexible polypeptide linker (indicated by arrow) whose density is missing in the crystal lattice. Flexibility of the hinge allows FN2 to adopt many conformations relative to FN1 as globally observed for structures of EphA2 (PDB entries 2X11, 3FL7, and 2X10) and its homolog EphA4 (PDB entries 4BK5, 4BKF, 4BK4, 4M4R, and 4M4P) when overlaid (right). (d) A theoretical dynamic model of rotated proximal and reciprocal FN2 domains (orange) constrained by F1 antigen‐binding fragments (Fabs) overlaid onto the observed active chain‐link cluster where FN2 domains (red) are illustrated (PDB entry 2X11). F1 Fabs (white) bound to EphA2 protomers recruiting distal kinases fail to sterically constrain the dynamics of FN2 and maintain the same dynamic properties as in activated EphA2 (red, PDB entry 2X11). Fab F1 engagement of EphA2 protomers engaging proximal and reciprocal protomers causes the FN2 to pivot (orange) on the flexible hinge away from the plane of the EphA2 cluster to avoid steric clashes between Fab F1 and the FN1 domains of adjacent receptors. (e) An open book projection from the membrane of F1‐displaced reciprocal and proximal FN2 domains of the extracellular domain (ECD) (left) and the F1‐induced kinase displacement of the intracellular domain (ICD) (right) of EphA2 chain‐link tetramers. Approximation of the conformational pivot of the ECD is illustrated as dashed arrows connecting apo FN2 (red) and F1‐bound FN2 (orange). The modeled pivot is projected onto the ICD kinases, illustrating the kinase displacement. ECD domains are colored as in (a). (f) Models of possible natural signal attentuation through FN2 constraint during cellular EphA2 zippered synapses. Surface representations of EphA2 in (i) a static signaling‐competent cluster (PDB entry 2X11), (ii) an auto‐inhibited cluster (PDB entry 2X11 and 3FL7), and (iii) an Eph‐Efn zipper (PDB entry 2X11) are illustrated in trans configuration. EphA2 and EfnA5 receptors on the surface of cell A are illustrated as colored ribbons with a white surface. EphA2 and EfnA5 receptors on the surface of cell B are illustrated as colored surfaces according to domains as in (a). Dynamic FN2 domains are illustrated with dashed circled arrows.
FIGURE 8
FIGURE 8
Partial agonist bouquet clusters. (a) Surface rendering of the asymmetric unit (ASU) of the 2:2 antigen‐binding fragment (Fab) C1:ligand‐binding domain (LBD)‐cysteine‐rich domain (CRD) complex. Fabs (white) are denoted C11 and C12, whereas the protomers of EphA2 are denoted LBD‐CRD1 and LBD‐CRD2. Cysteine‐rich domains (CRDs) are colored green and ligand‐binding domains (LBDs) blue. (b) Surface rendering of symmetrically related complexes in ASU1 and ASU2 associated by LL′ interfaces between LBD‐CRD1 and LBD‐CRD2 (top). CRDs (green) from ASU1 and ASU2 are bound by Fabs (white) to form a bouquet of EphA2 “flowers” being held by four “hands.” Surface rendering of symmetrically related complexes in ASU1 and ASU3 associated by one LL interface between LBD‐CRD1 and LBD‐CRD1 (bottom). (c) Top–down perspective of the octamer Fab:EphA2 extracellular domain (ECD) complex condensed by eight Fab/4 IgGs containing both LL and LL′ interacting protomers (left) and the register 2 tetramer chain‐link cluster (right) (protein data bank (PDB) entry 3FL7). EphA2 ECDs and Fabs are colored as in (a). IgG linkages between C11 and C12 Fabs are indicated with arrows. (d) Model of the full C1:ECD complex of the octamer created by overlaying the full ECD of EphA2 (PDB entry 2X11) onto the 8:8 Fab‐C1:LBD‐CRD. EphA2 domains are colored as follows: LBD (blue), CRD (green), N‐terminal fibronectin‐3 domain (purple), C‐terminal fibronectin‐3 domain (red). (e) VH/VL interface of EphA2‐bound Fabs/IgGs in the bouquet cluster. VH (dark gray) and VL (white) contact residues (<4.5 Å) are illustrated as sticks with Cα spheres. Hydrogen bonds are illustrated as dashed yellow lines. (f) The resultant proximal EphA2 pair with the bouquet octamer cluster is shown in domain colors. Distal receptors are shown as white ribbons.

References

    1. Adams JJ, Nelson B, Sidhu SS. Recombinant genetic libraries and human monoclonal antibodies. Methods Mol Biol. 2014;1060:149–170. - PubMed
    1. Alves DS, Westerfield JM, Shi X, Nguyen VP, Stefanski KM, Booth KR, et al. A novel pH‐dependent membrane peptide that binds to EphA2 and inhibits cell migration. Elife. 2018;7:e36645. - PMC - PubMed
    1. Annunziata CM, Kohn EC, LoRusso P, Houston ND, Coleman RL, Buzoianu M, et al. Phase 1, open‐label study of MEDI‐547 in patients with relapsed or refractory solid tumors. Invest New Drugs. 2013;31:77–84. - PMC - PubMed
    1. Arora S, Scott AM, Janes PW. Eph receptors in cancer. Biomedicine. 2023;11:315. - PMC - PubMed
    1. Bailey LJ, Sheehy KM, Dominik PK, Liang WG, Rui H, Clark M, et al. Locking the elbow: improved antibody fab fragments as chaperones for structure determination. J Mol Biol. 2018;430:337–347. - PMC - PubMed

MeSH terms

LinkOut - more resources