Case Reports
. 2025 May 24;45(1):98.
doi: 10.1007/s10875-025-01886-y.

Complete CD16A Deficiency and Defective NK Cell Function in a Man Living with HIV

Affiliations
Case Reports

Complete CD16A Deficiency and Defective NK Cell Function in a Man Living with HIV

Weiying Zhang et al. J Clin Immunol. .

Abstract

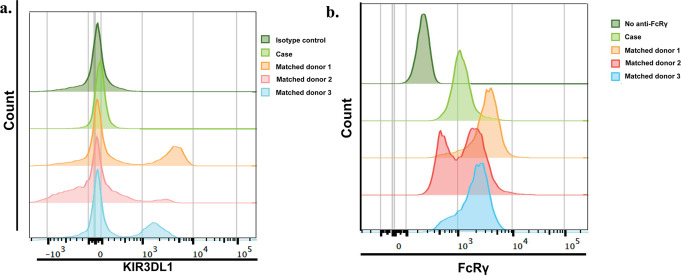
A man living with HIV was found to lack expression of CD16A on his natural killer (NK) cells and monocytes. Genetic analysis revealed compound heterozygous deletion of FCGR3A, the gene encoding CD16A. The case's NK cells showed: (a) no antibody-dependent cell-mediated cytotoxicity and very low spontaneous cytotoxicity; (b) an immature phenotype marked by high expression of CD94, CD2, NKG2A, and NKG2D, and low expression of KIR2DL2 and CD57; (c) no expression of KIR3DL1 and very low expression of FcRγ; and (d) normal cytokine production. The case's monocytes and DCs were similar phenotypically and functionally to those from the donors matched for HIV status, age, and percentage of NK cells in the peripheral blood. In contrast to previously reported people with CD16A deficiency, this man did not have a history of severe infections with herpes viruses, suggesting that other immune cells and/or immunoregulatory function of NK cells may compensate for deficiency of cytolytic NK cells.

Keywords: CD16A deficiency; Dendritic cell function; FCGR3A deletion; Monocyte function; NK cell function.


Conflict of interest statement

Declarations. Competing Interests: The authors declare no competing interests.

Figures

Fig. 1
Fig. 1
Lack of expression of CD16A on NK cells and monocytes of the case. The flow cytometric plots show the expression of CD16A on (a) NK cells and (b) monocytes of a healthy HIV-uninfected donor (control donor) and the case using two monoclonal antibodies (mAbs), B73.1 and 3G8, that recognize distinct epitopes of CD16A. NK cells and monocytes were identified as shown in Fig. S1. Gates for identifying CD16A expression were set based on staining of isotype controls (two leftmost columns). CD16A was detected by both mAbs on the cells of the control donor (third column from the left), but not the case (rightmost column) for both NK cells (a) and monocytes (b)
Fig. 2
Fig. 2
Sequencing results of the FCGR3A and FCGR3B loci from the case and the human reference sequence NA12878 [28]. a. Linked reads aligned around the low/medium-affinity FcγR locus on chromosome 1 with LongRanger™ (10X genomics) and displayed in Loupe™ (10X genomics). The yellow and purple lines represent the phased alignments of the two alleles of the locus in the case (upper pair of yellow and purple lines, panels 1 and 2) and the control (lower pair of yellow and purple lines, representing data from DNA from the cell line NA12878, panels 3 and 4) [28]. Gene regions are indicated above the data for the case, with FCGR3A and FCGR3B denoted by blue boxes. For the case, both alleles show regions with few, if any, aligned reads indicating deletions (blue brackets). In the yellow allele (panel 1) FCGR3A is completely deleted. In the purple allele (panel 2), most of FCGR3A and a small part of FCGR3B are deleted, as is the intervening DNA between the two genes. These regions, marked with asterisks for the purple allele, indicated a fusion near the 3’ end of each gene. The direction of expression is from right to left. b. Sanger sequence of PCR products around the expected breakpoint from the purple allele shown in a), in comparison to the human reference sequences for the FCGR3A and FCGR3B loci. Nucleotides in FCGR3B that differ from those in FCGR3A are shown in red. The data narrow the cross-over event to the 30 bp sequence highlighted in yellow, because nucleotides before this region are in agreement with the expected FCGR3A sequence (shown in blue letters) while those after this sequence agree with the sequence of FCGR3B (shown in red letters). The regions flanking the cross-over region shown in bold represent the location of the primers used for Sanger sequencing. The cross-over falls in the 3’ UTR of FCGR3B and replaces it with the sequence from the 3’ UTR of FCGR3A
Fig. 3
Fig. 3
Expression of (a) KIR3DL1 and (b) FcRγ on NK cells from the case and three matched control donors. NK cells were identified as CD3CD4CD8CD14CD19-TBX-21+ [29]. Relative fluorescence intensities of staining with (a) anti-KIR3DL1 antibody and (b) FcRγ for the case and three matched donors are shown in the light green, orange, red, and blue histograms, as indicated. The dark green histograms represent staining with (a) the isotype control antibody for KIR3DL1 and (b) the unstained control for FcRγ (no isotype control is available because anti-FcRγ is polyclonal), which were the same for all donors. (a) NK cells from all of the matched control donors expressed KIR3DL1, but NK cells from the case did not. (b) Comparing to control donors, expression of FcRγ was 2-fold lower in the NK cells from the case
Fig. 4
Fig. 4
Immune phenotyping of NK cells from the case and 3 matched control donors. Frozen PBMC from the case and three matched control donors were analyzed for expression of NK cell markers. NK cells were identified as CD3CD4CD8CD14CD19-TBX-21+ cells (not shown). NK cell populations from the case and the matched control donors were concatenated together for dimension-reduction by UMAP and clustering by FlowSom. (a). UMAP displays the 7 clusters (pop 1–7) of NK cells identified by FlowSom. (b). The table lists the relative expression intensity of each marker on each cluster. The highlighted markers in each row, as well as CD56 and CD16, were assigned by marker enrichment modeling to define each cluster [43]. (c). The same UMAP shows that NK cells from the case (blue) were highly enriched in cluster 6 (Pop 6) as compared to NK cells from the matched control donors (purple). (d). The relative abundance of NK cells from the case (blue) and the matched control donors (purple) in each cluster. (e). The fluorescence intensity of each marker measured on NK cells is shown on UMAP axes. The color ranges from blue (low fluorescence intensity) to red (high fluorescence intensity)
Fig. 5
Fig. 5
Cytotoxicity of NK cells against (a) K562 cells (spontaneous cytotoxicity) and (b) rituximab-coated Raji cells (ADCC) for the case (orange) and 3 HIV-infected men (blue) who were matched with the case by study visits, age (± 5 years), status of HIV viral suppression, and percentage of NK cells among lymphocytes. In each of three experiments, PBMC from the case and from a matched control donor were tested at the 4 Effector: Target (E: T) ratios indicated, as described in Methods. The blue circles and error bars represent the means and standard errors of triplicate measurements of cytotoxicity for the matched controls. The orange circles and error bars represent the means and standard errors of measurements of cytotoxicity for the case from the three experiments performed
Fig. 6
Fig. 6
Cytokine production by NK cells from the case and two matched donors in response to innate cytokines. NK cells purified by magnetic bead negative selection were cultured in media alone (unstimulated, yellow bars), in the presence of IL-18 (red bars), IL-18 + IL-2 (burgundy bars), or IL-18 + IL-15 (purple bars) for 48 h. (a and b) Production of IFN-γ and MIP-1β by CD3CD56+ live cells was assessed by intracellular flow cytometric analysis. (c and d) Concentrations of IFN-γ and TNF-α in the culture supernatants were assessed by multiplex electrochemiluminescence immunoassay. The error bars represent standard errors of duplicate measurements of concentrations of the cytokines in the culture supernatants

References

    1. Bruhns P. Properties of mouse and human IgG receptors and their contribution to disease models. Blood. 2012;119:5640–9. - PubMed
    1. Nimmerjahn F, Ravetch JV. Fcγ receptors as regulators of immune responses. Nat Rev Immunol. 2008;8:34–47. - PubMed
    1. Guilliams M, Bruhns P, Saeys Y, Hammad H, Lambrecht BN. The function of Fcγ receptors in dendritic cells and macrophages. Nat Rev Immunol. 2014;14:94–108. - PubMed
    1. Yeap WH, Wong KL, Shimasaki N, Teo ECY, Quek JKS, Yong HX, et al. CD16 is indispensable for antibody-dependent cellular cytotoxicity by human monocytes. Sci Rep. 2016;6:34310. - PMC - PubMed
    1. Grier JT, Forbes LR, Monaco-Shawver L, Oshinsky J, Atkinson TP, Moody C, et al. Human immunodeficiency-causing mutation defines CD16 in spontaneous NK cell cytotoxicity. J Clin Invest. 2012;122:3769–80. - PMC - PubMed

Publication types

LinkOut - more resources