. 2025 Jun 24;44(6):115740.
doi: 10.1016/j.celrep.2025.115740. Epub 2025 May 22.

MePCE promotes homologous recombination through coordinating R-loop resolution at DNA double-stranded breaks

Affiliations

MePCE promotes homologous recombination through coordinating R-loop resolution at DNA double-stranded breaks

Sravan K Devanathan et al. Cell Rep. .

Abstract

MePCE is a multifunctional protein that regulates the positive transcription elongation factor b (P-TEFb) partitioning between the nucleosol and chromatin. MePCE's role in sequestering P-TEFb in the nucleosol via the 7SK ribonuclear protein complex (RNPc) is clear, but its functions on chromatin remain obscure. We report that chromatin-associated MePCE interacts with R-loop processing and DNA repair factors. MePCE is recruited to DNA double-stranded breaks (DSBs), and MePCE depletion impairs DSB repair by homologous recombination (HR), decreases RAD51 loading, and enhances R-loop levels at AsiSI-induced DSBs at specific genomic locations. Besides decreasing specific R-loop processing factors and chromatin remodelers, MePCE depletion increases the interaction with R-loops of the other constitutive member of the 7SK RNPc, LARP7, which is degraded by BRCA1/BARD1 upon DSB. Overall, our results uncover dynamic regulation of the 7SK RNPc at DSBs during the DSB repair process and explain the recently observed synthetic lethality of MePCE and BRCA1 deficiency.

Keywords: 7SK; BRCA1; CP: Molecular biology; DNA repair; DRIP-MS; DRIP-seq; FACT; LARP7; MePCE; R-loops; homologous recombination.


Conflict of interest statement

Declaration of interests The authors declare no competing interests.

Figures

Figure 1.
Figure 1.. MePCE’s main interactors on chromatin are linked to DNA repair and R-loops
(A) Experimental design illustrating FLAG-tag purification in HeLa-S3-FlpIn GFP or MePCE-FLAG cells. Cells were lysed and digested with mock, RNase A, or MNase enzymes to identify nucleosol-specific (mock), RNase A-resistant (+RNase A), and nucleosol+chromatin-specific (+MNase) interactors of MePCE. The samples were then run on a Bis-Tris 4%–12% gradient gel, cut into 10 patches, trypsin digested into peptides, and desalted. The trypsin-digested peptides were subjected to LC-MS/MS analysis. (B) Colloidal Coomassie blue-stained gel shows MePCE-FLAG (MePCEf) or GFP pull-down samples treated with mock, RNase A, or MNase enzymes. Red asterisk indicates the position of MePCE on the resolved gel. See also Figure S1 for analysis by western and northern blot and Table S1 for the LC-MS/MS results. (C) Venn diagram showing >60% overlap between MePCE chromatin interactors and two independently generated R-loop interactomes (published by the Gromak and Sarma groups). The red circle denotes the 68 shared interactors between the three datasets. (D) Z score-transformed heatmap illustrating enrichment of the 68 shared interactors in the three digestion conditions. The red brackets and labels indicate major protein families. Black asterisks denote factors with established roles in R-loop processing in cells, and red asterisks denote factors with established roles in DNA damage repair.
Figure 2.
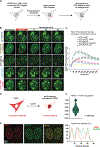
Figure 2.. MePCE is directly recruited to laser-induced DNA damage and double-stranded break sites
(A) Schematic illustrating laser-induced DNA damage recruitment assay. U2OS Flp-In TREx cells expressing the GFP-tagged protein of interest were presensitized using bromodeoxyuridine (BrdU) and laser-damaged, and protein recruitment was measured through recovery of fluorescence in the damaged area. (B) Representative images from the laser-induced DNA damage recruitment assay, showing recruitment over time of the indicated GFP-tagged proteins to the DNA damage focus (white dotted circle). The scale bar is 5 μm. (C) Recruitment kinetics of the indicated GFP-tagged proteins to DNA damage focus (mean ± SEM, n = 18 cells). The x axis represents time (in seconds) after damage, while the y axis shows the ratio of fluorescence intensity in the damaged focus (white dotted circle in Figure 2A) versus an undamaged focus of the same GFP intensity in the same cell. (D) Schematic illustrating the AsiSI-ER AiD DiVA tamoxifen-inducible DSB system. Upon treatment with 4-hydroxytamoxifen (4-OHT), AsiSI translocates from the cytoplasm to the nucleus, inducing DSBs at actively transcribed regions on the DNA. (E) Images from the AsiSI-induced site-specific DSB assay showing colocalization between MePCE (green) and the DNA damage marker γH2AX (red) 4 h after 4-OHT treatment. On the right, shown is the fluorescence intensity plot profile of the two channels (red and green) measured along the yellow line traversing through 3 DNA damage foci. The scale bar is 5 μm. (F) Quantification of the colocalization between MePCE and γH2AX in a violin plot (n > 200 cells). The y axis represents the ratio of γH2AX foci colocalizing with MePCE over the total number of γH2AX foci for each cell, represented in yellow. The black dotted line represents the mean, while the pink dotted lines represent the 25% and 75% quartiles.
Figure 3.
Figure 3.. MePCE depletion dampens RAD51 localization to DSBs, leading to accumulation of DNA damage in cells
(A and B) Double-strand break reporter assays in U2OS EJ5 and DR-GFP cells after siNC and siMePCE treatment (mean ± SEM, n = 3 and 4 biological replicates, respectively). (C) Heatmap representation of input and ChIP-seq binding for XRCC4 and RAD51 around the 111 active AsiSI DSB sites ±10 kb in U2OS AsiSI-ER AiD DiVA siNC and siMePCE cells treated for 4 h with 4-OHT. (D) Representative images from the immunofluorescence assay with γH2AX (red) and 53BP1 (green) antibodies in U2OS AsiSI-ER AiD DiVA siNC and siMePCE cells treated for 4 h with 4-OHT. The scale bar is 30 μm. (E) Quantification of the γH2AX foci/cell in U2OS AsiSI-ER AiD DiVA siNC and siMePCE cells treated for 4 h with 4-OHT, represented as a violin plot (n > 150 cells). A simple unpaired t test was used to compare the two distributions.
Figure 4.
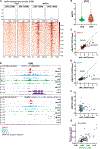
Figure 4.. MePCE directly binds to DSB breaks with high levels of R-loops
(A) Heatmap representation of input and ChIP-seq binding for MePCE around the 111 active AsiSI DSB sites ±5 kb in U2OS siNC untreated (–DSB) and U2OS AsiSI-ER AiD DiVA siNC cellsdataset from the Legube treated for 4 h with 4-OHT (+DSB). (B) Analysis of MePCE binding at AsiSI DSB sites in U2OS untreated (–DSB) and U2OS-AsiSI cells induced for 4 h with 4-OHT (+DSB). MePCE ChIP-seq reads in CPM were normalized consecutively to input, siMePCE, and GFP (negative control) around the 111 active AsiSI DSB sites ±10 kb. A simple unpaired t test was used to compare the two distributions. (C) Correlation plot of XRCC4 ChIP-seq signal between siNC (x axis) and siMePCE (y axis) around the 111 active AsiSI DSB sites ±10 kb. The red line shows the simple linear regression line derived from the data, while the gray line shows an idealized simple linear regression line with R2 = 1. ALAS1- and LINC0197C-associated DSB sites are indicated. (D) Correlation plot of RAD51 ChIP-seq signal between siNC (x axis) and siMePCE (y axis) around the 111 active AsiSI DSB sites ±10 kb. The blue line shows the simple linear regression line derived from the data, while the gray line shows an idealized simple linear regression line with R2 = 1. ALAS1- and LINC0197C-associated DSB sites are indicated. (E) IGV browser ChIP-seq tracks for XRCC4 (red), RAD51 (blue), and MePCE (green) binding and RNA-seq tracks (light purple) at AsiSI-mediated DSB sites within the LINC01970 and ALAS1 genes (hg19 human reference genome). Shown are also DRIP-seq data (dark purple) from the Legube lab using the same cell line in ± 4-OHT conditions. (F) Correlation plot between RAD51 (x axis) and MePCE (+DSB) (y axis) ChIP-seq signal in siNC cells around the 111 active AsiSI DSB sites ±10 kb. The blue line shows the simple linear regression line derived from the data. (G) Correlation plot of MePCE (+DSB) ChIP-seq signal in siNC (x axis) and DRIP-seq (+4-OHT) dataset from the Legube lab (y axis) around the 111 active AsiSI DSB sites ±10 kb. The purple line shows the simple linear regression line derived from the data, R2 = 0.5384.
Figure 5.
Figure 5.. MePCE depletion increases R-loop levels at DSB breaks
(A) Heatmap representation of DRIP-seq around the 111 active AsiSI DSB sites ±10 kb in U2OS AsiSI-ER AiD DiVA siNC and siMePCE cells treated for 4 h with 4-OHT. Treatment with RNase H (+RNase H), which specifically degrades RNA within RNA/DNA hybrids, serves as control for the specificity of the S9.6 antibody. (B) IGV browser DRIP-seq tracks within the LINC01970 and ALAS1 genes (hg19 human reference genome). In the LINC01970/siNC + Mock window, in light purple is overlaid LINC01970/siMePCE + Mock DRIP-seq signal; the box on the right shows a zoomed-in image around the DSB site in LINC01970. (C) Correlation plot of the DRIP-seq (x axis) and RAD51 ChIP-seq (y axis) fold change in Log2 scale in siMePCE/siNC (y axis) around the 111 active AsiSI DSB sites ±10 kb.
Figure 6.
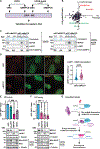
Figure 6.. MePCE depletion affects the presence of R-loop-interacting proteins at DSBs
(A) Schematic of the analysis of the R-loop interactome by DRIP-MS in untreated cells and after AsiSI-induced DSBs in control (siNC) and MePCE-depleted (siMePCE) U2OS cells. (B) Correlation of iBAQ score ratios (siMePCE/siNC) of the identified proteins in AsiSI-damaged (y axis) versus undamaged (x axis) cells. (C) Validation of DRIP-MS results by western blot with the indicated proteins. (D) On the left, shown are representative images from the AsiSI-induced site-specific DSB assay showing colocalization between LARP7 (green) and the DNA damage marker γH2AX (red) 4 h after 4-OHT treatment in U2OS-AsiSI siNC and siBRCA1 cells. The scale bar is 10 μm. On the right, shown is quantification of the colocalization between LARP7 and γH2AX in a violin plot (n > 100 cells) in U2OS-AsiSI siNC and siBRCA1 cells. The y axis represents the ratio of γH2AX foci colocalizing with LARP7 over the total number of γH2AX foci for each cell. ****p value < 0.0001 in a Welch’s t test. (E and F) Double-strand break reporter assays in U2OS DR-GFP cells after the indicated single and dual treatments (mean ± SEM, n = 4 and 3 biological replicates) and the western blots showing siRNA transfection efficiency. The shown p values were calculated with an ordinary one-way ANOVA statistical test. Shown are also western blots with RPA2-S33P and total RPA2 from U2OS-AsiSI cells induced for 4 h with 4-OHT. αTubulin is used as a loading control for both sets of western blots. (G) Schematic representing the model on how MePCE may affect repair by HR.

References

    1. Anshabo AT, Milne R, Wang S, and Albrecht H (2021). CDK9: A Comprehensive Review of Its Biology, and Its Role as a Potential Target for Anti-Cancer Agents. Front. Oncol 11, 678559. 10.3389/fonc.2021.678559. - DOI - PMC - PubMed
    1. Jeronimo C, Forget D, Bouchard A, Li Q, Chua G, Poitras C, Thérien C, Bergeron D, Bourassa S, Greenblatt J, et al. (2007). Systematic analysis of the protein interaction network for the human transcription machinery reveals the identity of the 7SK capping enzyme. Mol. Cell 27, 262–274. - PMC - PubMed
    1. Yang Y, Eichhorn CD, Wang Y, Cascio D, and Feigon J (2019). Structural basis of 7SK RNA 5’-γ-phosphate methylation and retention by MePCE. Nat. Chem. Biol 15, 132–140. 10.1038/s41589-41018-40188-z. - DOI - PMC - PubMed
    1. Shelton SB, Shah NM, Abell NS, Devanathan SK, Mercado M, and Xhemalçe B (2018). Crosstalk between the RNA Methylation and Histone-Binding Activities of MePCE Regulates P-TEFb Activation on Chromatin. Cell Rep 22, 1374–1383. 10.1016/j.celrep.2018.1301.1028. - DOI - PubMed
    1. Xue Y, Yang Z, Chen R, and Zhou Q (2010). A capping-independent function of MePCE in stabilizing 7SK snRNA and facilitating the assembly of 7SK snRNP. Nucleic Acids Res 38, 360–369. 10.1093/nar/gkp1977. - DOI - PMC - PubMed

LinkOut - more resources