. 2025 Jul 9;5(7):100888.
doi: 10.1016/j.xgen.2025.100888. Epub 2025 May 23.

Single-cell profiling of bone metastasis ecosystems from multiple cancer types reveals convergent and divergent mechanisms of bone colonization

Affiliations

Single-cell profiling of bone metastasis ecosystems from multiple cancer types reveals convergent and divergent mechanisms of bone colonization

Fengshuo Liu et al. Cell Genom. .

Abstract

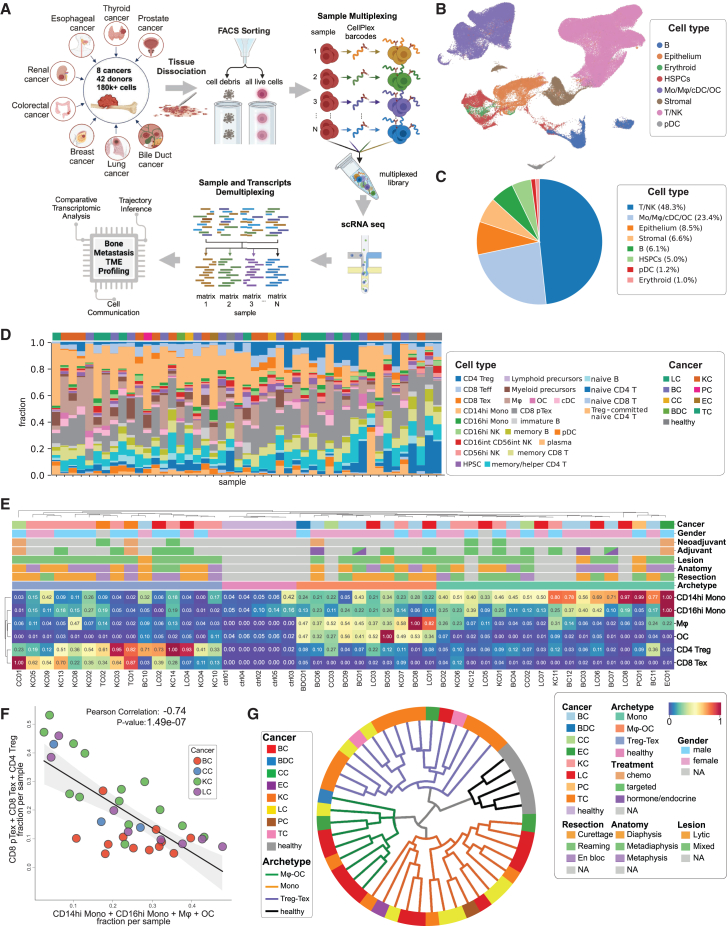
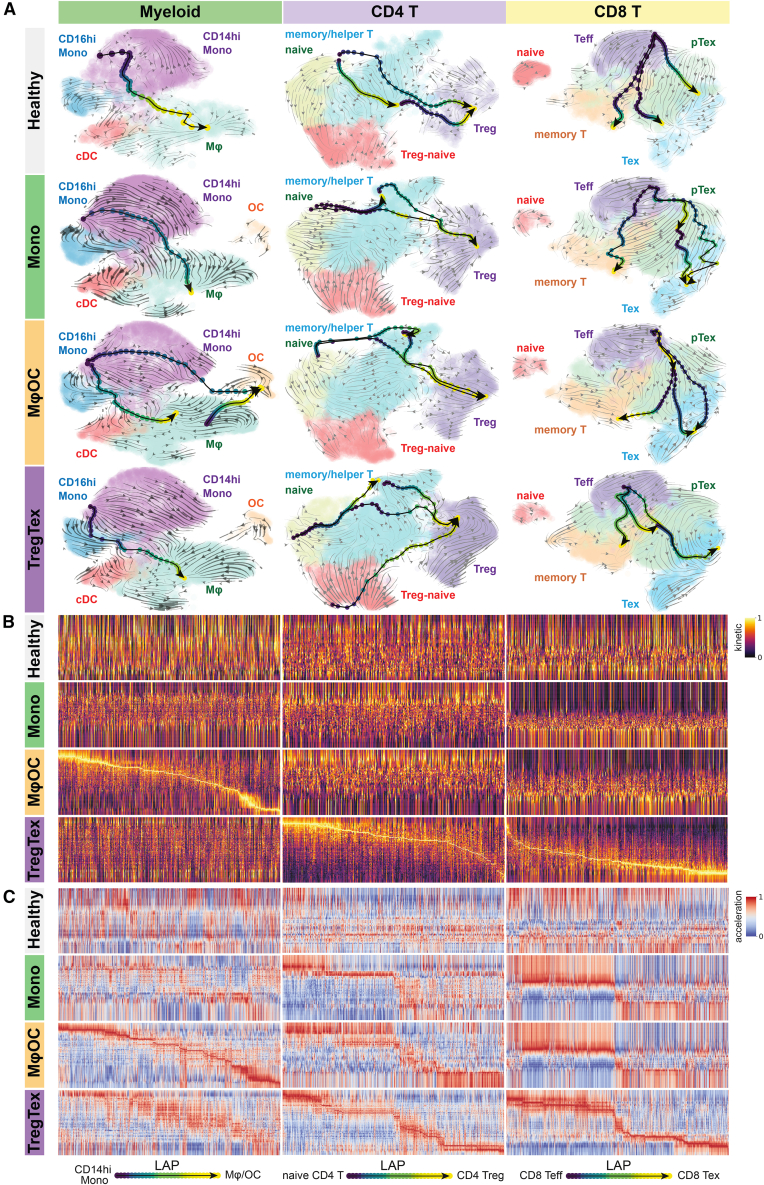
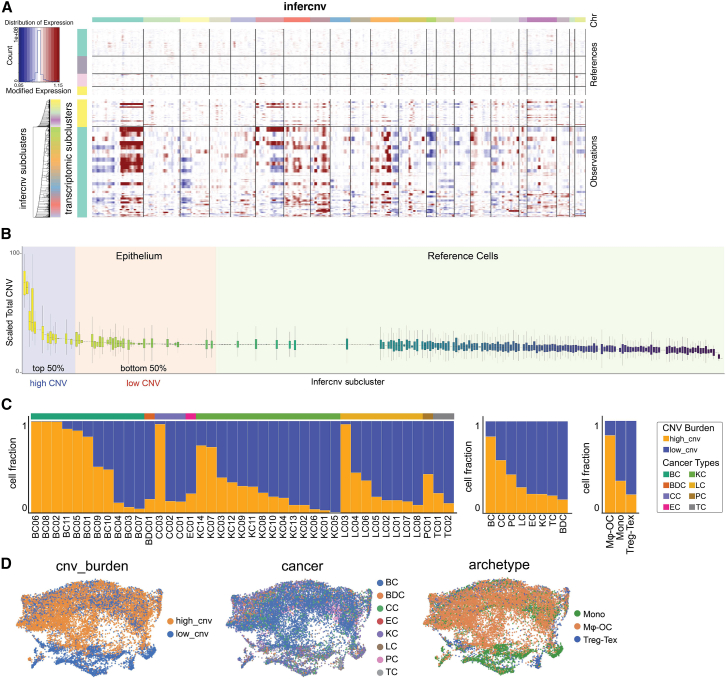
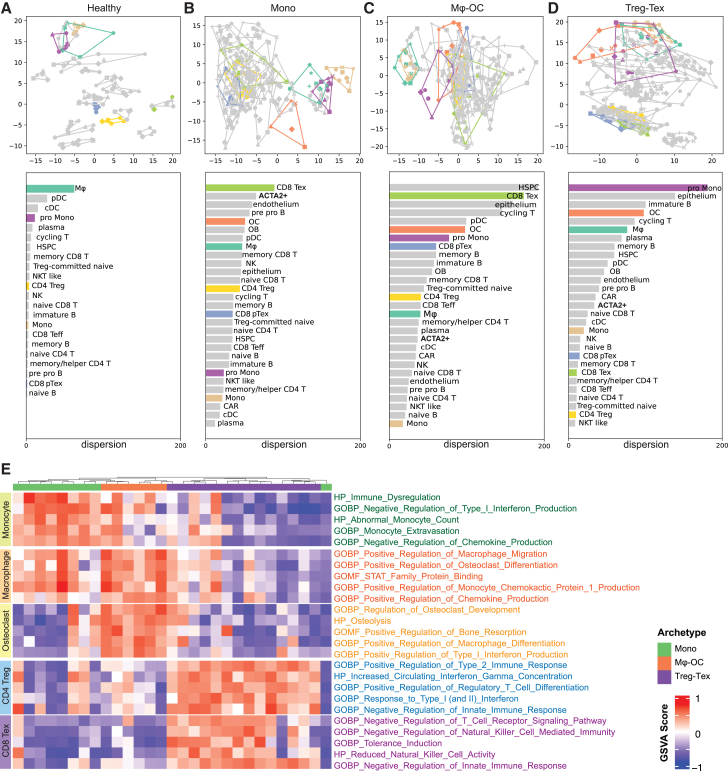
Bone is a common site for metastasis of solid cancers. The diversity of histological and molecular characteristics of bone metastases (BMs) remains poorly studied. Here, we performed single-cell RNA sequencing on 42 BMs from eight cancer types, identifying three distinct ecosystem archetypes, each characterized by an enrichment of specific immune cells: macrophages/osteoclasts, regulatory/exhausted T cells, or monocytes. We validated these archetypes by immunostaining on tissue sections and bioinformatic analysis of bulk RNA sequencing/microarray data from 158 BMs across more than 10 cancer types. Interestingly, we found only a modest correlation between the BM archetypes and the tissues of origin; BMs from the same cancer type often fell into different archetypes, while BMs from different cancer types sometimes converged on the same archetype. Additional analyses revealed parallel immunosuppression and bone remodeling mechanisms, some of which were experimentally validated. Overall, we discovered unappreciated heterogeneity of BMs across different cancers.

Keywords: bone metastases; convergent and divergent evolution; immune archetypes; immune evasion; immunosuppression; single-cell RNA sequencing; tumor microenvironment.


Conflict of interest statement

Declaration of interests The authors declare no competing interests.

Figures

None
Graphical abstract
Figure 1
Figure 1
Overview of study design and immune archetypes among patients (A) Overview of the study workflow, illustrating the process from data collection to analysis. Forty-two patients and five healthy donors were included, resulting in more than 180,000 high-quality cells post-preprocessing and quality control (QC). (Illustration created with BioRender.) (B) UMAP projection depicting major cell types. (C) Pie chart details the proportion of each major cell type relative to the overall cell count. (D) Stacked bar plot depicting the frequency of detailed immune cell types (as annotated in Figure S1C) across individual patients. Cancer types for each patient are annotated above the corresponding bars. (E) Patient hierarchical clustering based on scaled (min-max standardized across patient data, ranging from 0 to 1) cell frequencies, revealing three immune archetypes: monocyte-enriched (Mono), macrophage/osteoclast-enriched (Mφ-OC), and regulatory/exhausted T cell-enriched (Treg-Tex), distinct from healthy control donors. (F) Pearson correlation analysis of myeloid cell frequency against the/of immunosuppressive T cells (pTex, Tex, and Treg) in breast cancer (BC), kidney cancer (KC), colorectal cancer (CC), and lung cancer (LC) patients, revealing a significant inverse relationship. (G) Circular hierarchical plot illustrating the classification of individual patients based on their immune archetypes, derived from (E). Cancer types are represented by colored blocks, while immune archetypes are denoted by branching colored lines.
Figure 2
Figure 2
Immunofluorescence staining verifies distinct immune archetypes (A) Representative fields selected from tissue section immunofluorescence (IF) staining of patients classified by archetypes (columns), highlighting three major cell types (rows). CTSK marks the OC population, CD4 and FOXP3 double-positive signals indicate CD4 Treg populations, and CD8A and TIM3 double-positive signals represent CD8 Tex populations. (B) Cell counting from IF staining of tissue sections from 21 patients, grouped by archetypes: Mφ-OC (N = 6 patients), Treg-Tex (N = 8 patients), and Mono (N = 7 patients). Three major cell types were analyzed: OC cells were manually counted from entire tissue sections. Treg and Tex populations were quantified from selected fields (regions of interest based on CD4 or CD8A positivity, shown in Figure S2). Left: Proportion of OC cells out of total cells; Middle: Proportion of CD4 Tregs out of total CD4 T cells; Right: Proportion of CD8 Tex cells out of total CD8 T cells. (Significance test: One-way ANOVA, ∗p < 0.05; ∗∗p < 0.01).
Figure 3
Figure 3
Immune archetypes in published dataset (A) Schematic of the workflow for cell type identification and frequency estimation. (Illustration created with BioRender.) (B) Hierarchical clustering of 957 patients (columns) based on estimated cell types and their frequencies (rows). (C) Subset analysis of 158 patients (from B) with cancer metastasis to the bones. Patients were clustered into three groups based on the frequencies of selected cell types: Monocytes, Mφ, OC, CD4 Treg, CD8 pTex, and CD8 Tex. (D) Confusion matrix displaying the correlation clustering of matched patients based on the cell frequencies of selected cell types (from C), comparing the primary breast tumor microenvironment (TME) with their bone metastasis TME. (E) Confusion matrix displaying patient clustering based on the frequencies of selected cell types, annotated with patients' progression-free survival (PFS). (F) Correlation analysis of patients from (E), examining the relationship between PFS probability and the expression of Treg and Tex cell signatures (Treg/Tex infiltration). The analysis was conducted across different metastatic tissues (p values reported from Log Rank Test).
Figure 4
Figure 4
Distinct differentiation routes of myeloid populations and T lymphocytes (A) Trajectory inferences of myeloid and T cells (columns) across archetypes (rows). Streamlines in the background UMAP represent unbiased, calculated cell state transitions, while arrows and gradient-colored dots depict supervised least action paths (LAPs), directed from designated initiating cell populations to terminal cell populations: CD14hi Mono to Mϕ/OC (Myeloid), naive CD4 T to CD4 Treg (CD4 T), and CD8 Teff to CD8 Tex (CD8 T). (B) Gene expression kinetics (RNA velocity). Clear and visible kinetic shifts indicate committed differentiation events. (C) Gene expression accelerations (a derivative of RNA velocity). Distinct and visible acceleration shifts indicate committed differentiation potential.
Figure 5
Figure 5
Characterization of cancer epithelial cell CNV burden and its correlation with immune archetypes (A) Epithelium copy number variation (CNV) estimation. Endothelium, CAR, OB, ACTA2+, and endothelium were selected as references in epithelium CNV estimations. (B) Assessment of CNV load. Scaled CNV scores for each inferred subcluster (calculated by infercnv) were used to rank the subclusters. Cells in the top 50% were assigned to the high CNV group, while the remaining 50% were assigned to the low CNV group. (C) Distribution of CNV scores across patients, cancer types, and immune archetypes, with the frequency of epithelial cells in high and low CNV burden groups displayed for each category. (D) UMAP projection of epithelial CNV burden, cross-displayed by cancer types and immune archetypes.
Figure 6
Figure 6
Convergent evolution of driver cell populations across archetypes (A–D) PCA-based transcriptional variance across patients. Top: PCA plot showing each cell type per patient, with colors representing cell types and dots representing individual patients. Joint lines outline the dispersion of transcriptional variance for each cell type. Bottom: Ranked dispersion (in descending order of variance) for each cell type across patients within the corresponding immune archetype. (E) Selected gene set variation analysis (GSVA) results comparing major cell types across immune archetypes.
Figure 7
Figure 7
Bone stromal drives divergent bone colonization and immune evasion mechanisms (A) Analysis of cell-cell communication signal flow. Outgoing signal strength is shown on the x axis and incoming signal strength on the y axis, comparing the Mφ-OC and Treg-Tex archetypes with healthy samples serving as references. (B) Identification of key ligand-receptor pairs that differentially regulate the OC populations. This analysis compares the relative signaling strengths between the Mφ-OC and Treg-Tex archetypes, focusing on osteoclasts as the signal receivers (from Figure S5A). (C) Schematic illustration of in vitro experimental validation for estimated signaling molecules. CD14+ monocytes isolated from human peripheral blood were enriched for osteoclastogenesis induction, with selected factors added to the culture medium to test their predicted roles in regulating differential osteoclastogenesis. Osteoclastogenesis was then evaluated by both qPCR and TRAP staining. (D) qPCR analysis of osteoclast signature genes to validate differential osteoclastogenesis regulation by estimated signaling molecules. Each signaling factor was tested using graded concentrations: TWEAK (TNFSF12; 0.1, 1, 10 ng/μL), COMP (5, 50, 500 ng/μL), and NRG1 (10, 100, 1000 ng/μL), TNFSF10 (1, 10, 100 ng/μL), SEMA4A (1, 10, 100 ng/μL), EFNA5 (1, 10, 100 ng/μL), BMP8A (1, 10, 100 ng/μL). Each condition has five replicates. Statistical significance was assessed using one-way ANOVA, with significance levels: ∗p < 0.05; ∗∗p < 0.01; ∗∗∗p < 0.001; ∗∗∗∗p < 0.0001.

References

    1. Florencio-Silva R., Sasso G.R.D.S., Sasso-Cerri E., Simões M.J., Cerri P.S. Biology of Bone Tissue: Structure, Function, and Factors That Influence Bone Cells. BioMed Res. Int. 2015;2015 doi: 10.1155/2015/421746. - DOI - PMC - PubMed
    1. Clarke B. Normal bone anatomy and physiology. Clin. J. Am. Soc. Nephrol. 2008;3:S131–S139. doi: 10.2215/CJN.04151206. - DOI - PMC - PubMed
    1. Ho M.S.H., Medcalf R.L., Livesey S.A., Traianedes K. The dynamics of adult haematopoiesis in the bone and bone marrow environment. Br. J. Haematol. 2015;170:472–486. doi: 10.1111/bjh.13445. - DOI - PubMed
    1. Mundy G.R. Metastasis to bone: causes, consequences and therapeutic opportunities. Nat. Rev. Cancer. 2002;2:584–593. doi: 10.1038/nrc867. - DOI - PubMed
    1. Ghajar C.M., Peinado H., Mori H., Matei I.R., Evason K.J., Brazier H., Almeida D., Koller A., Hajjar K.A., Stainier D.Y.R., et al. The perivascular niche regulates breast tumour dormancy. Nat. Cell Biol. 2013;15:807–817. doi: 10.1038/ncb2767. - DOI - PMC - PubMed

LinkOut - more resources