. 2025 Sep;22(5):e00615.
doi: 10.1016/j.neurot.2025.e00615. Epub 2025 May 23.

Gut microbiota mediates semaglutide attenuation of diabetes-associated cognitive decline

Affiliations

Gut microbiota mediates semaglutide attenuation of diabetes-associated cognitive decline

Liqin Qi et al. Neurotherapeutics. 2025 Sep.

Abstract

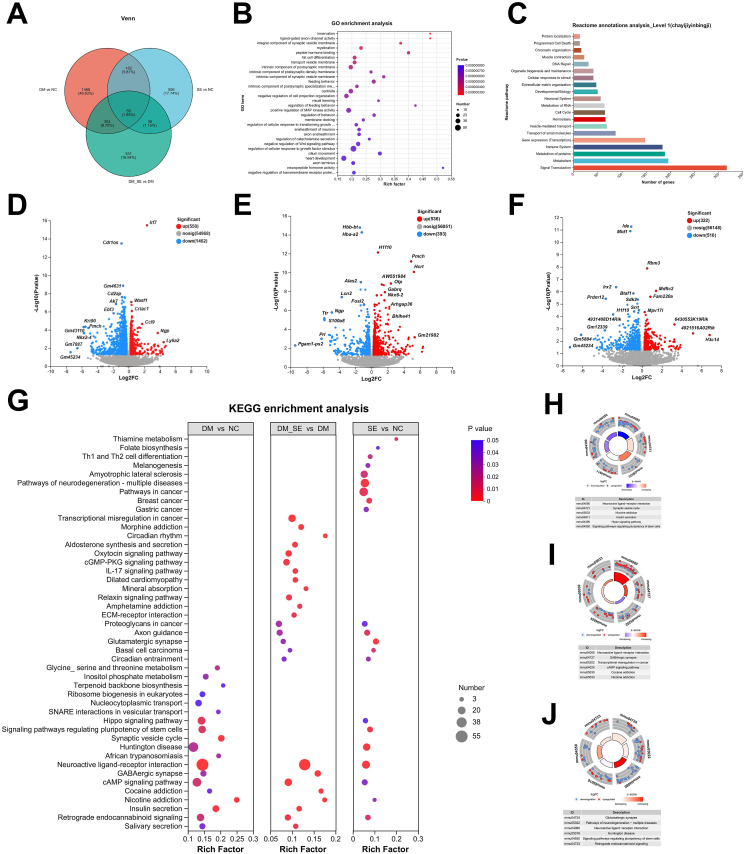
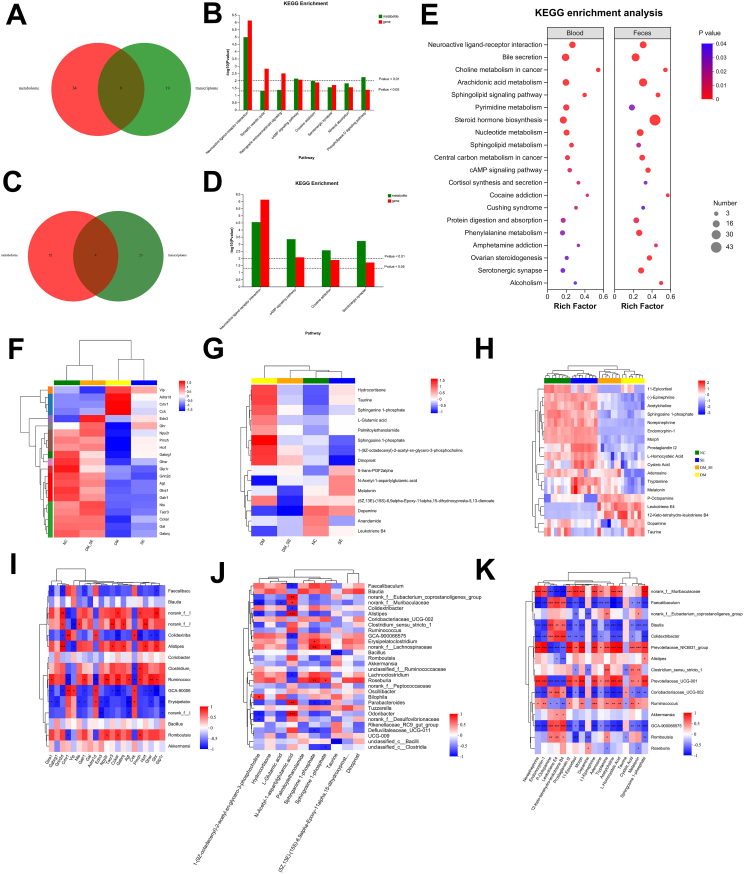
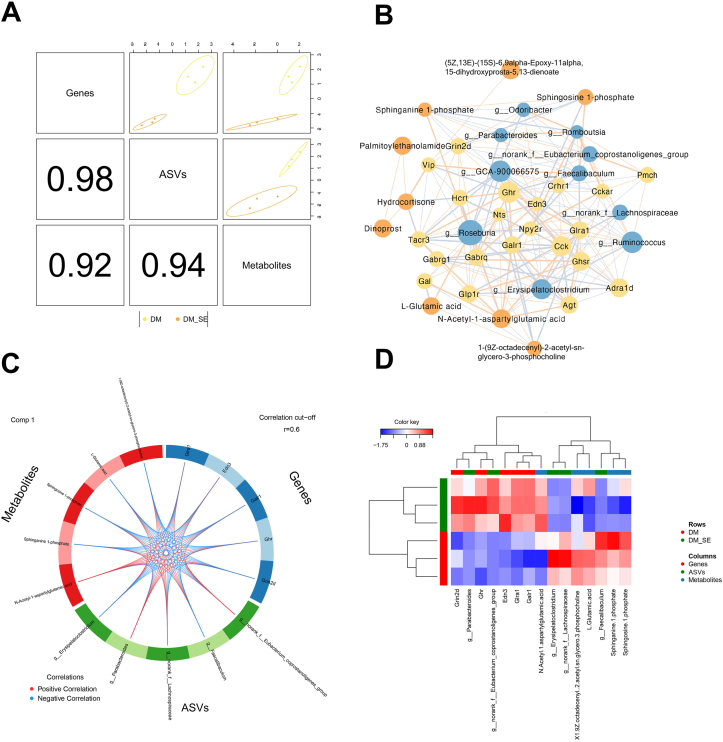
Diabetes-associated cognitive decline (DACD), characterized by cognitive impairment, is a serious complication of diabetes mellitus (DM). Research has shown that semaglutide, a novel glucagon-like peptide-1 receptor agonist, has neurotrophic and neuroprotective properties. However, a comprehensive understanding of the specific effects and underlying mechanisms of semaglutide treatment in patients with DACD remains lacking. In this study, we evaluated the potential of semaglutide to alleviate DACD in mice with DM. Eight-week-old mice fed a high-fat diet with streptozotocin-induced DM were subcutaneously injected with semaglutide (30 ​nmol/kg qd) for 12 weeks. Semaglutide administration significantly alleviated cognitive impairment, inhibited hippocampal neuron loss, improved the hippocampal synaptic ultrastructure, and effectively mitigated neuroinflammation. Furthermore, semaglutide treatment increased the relative abundances of g_Alistipes, g_norank_f_Eubacterium_coprostanoligenes, g_Bacteroides, and g_Parabacteroides, while decreasing the relative abundances of g_ faecalibaculum, g_Colodertribacter, g_GCA-900066575, g_Erysipelatoclostridium, and g_norank_f_Lachnospiraceae. Semaglutide also induced alterations in fecal and serum metabolites, as well as transcriptomic changes in brain tissue, with significant common enrichment in neuroactive ligand-receptor interactions. Furthermore, strong correlations were observed among semaglutide-affected genes, metabolites, and microbiota, as assessed by correlation analysis and integrative modeling. In conclusion, these findings suggest a correlation between the protective effects of semaglutide against DACD and the microbiota-gut-brain axis.

Keywords: Cognitive impairment; Gut microbiota; Metabolome; Neuroactive ligand-receptor interactions; Semaglutide.


Conflict of interest statement

Declaration of Competing Interest The authors have declared no competing interests.

Figures

Image 1
Graphical abstract
Fig. 1
Fig. 1
Semaglutide treatment improved learning and memory impairments in DM mice. (A) Timeline of the study and experimental design. (B) Body weight of each group (n ​= ​10–12 mice per group). (C) Food intake. (D) Caloric intake. (E) Random blood glucose levels across weeks. (F) Fasting blood glucose levels. (G) Serum TG concentration (H) Serum LDL-C concentration (n ​= ​6–8 mice per group). (I) Escape latency during the 5-day training trial in the Morris water maze test. (J) Number of platform crossings. (K) Time spent in the target quadrant. (L) Swimming speed in the spatial exploration test. (M) Representative swimming tracks of mice during the acquisition trial phase on day 5 and probe trials (n ​= ​10–12 mice per group). Abbreviations: NC: normal control group; SE: normal control with semaglutide group; DM: Diabetes mellitus group; DM_SE: Diabetes mellitus with semaglutide group. Data are presented as mean ​± ​SD. ∗p ​< ​0.05, ∗∗p ​< ​0.01, ∗∗∗p ​< ​0.001, ∗∗∗∗p ​< ​0.0001.
Fig. 2
Fig. 2
Effect of semaglutide treatment on neurons and synapsis in the hippocampus. (A) Representative graphs of Nissl staining in the hippocampus (n ​= ​4 per group). (B–E) Number of neurons in CA1 region (B), CA3 region (C), CA4 region (D), and DG region (E). (F) Ultrastructure of chemical synapses in hippocampal CA1 region (n ​= ​3 per group). (G) Thickness of postsynaptic density (PSD)(H) Width of the synaptic cleft. White arrow: synapse. Abbreviations: NC: normal control group; SE: normal control with semaglutide group; DM: Diabetes mellitus group; DM_SE: Diabetes mellitus with semaglutide group. Data presented as mean ​± ​SD. ∗p ​< ​0.05, ∗∗p ​< ​0.01, ∗∗∗p ​< ​0.001, ∗∗∗∗p ​< ​0.0001.
Fig. 3
Fig. 3
Effect of semaglutide treatment on neuroinflammation. (A) Immunofluorescent images of GFAP (green)/Iba-1 (red) colocalization in the hippocampus. (B) Immunofluorescent images of GFAP (green)/Iba-1 (red) colocalization in the cortex. (n ​= ​3/group). (C–D) Number of GFAP/Iba-1 positive cells in the hippocampus. (E–F) Number of GFAP/Iba-1 positive cells in the cortex. (n ​= ​3/group). Abbreviations: NC: normal control group; SE: normal control with semaglutide group; DM: Diabetes mellitus group; DM_SE: Diabetes mellitus with semaglutide group. Data presented as mean ​± ​SD. ∗p ​< ​0.05, ∗∗p ​< ​0.01, ∗∗∗p ​< ​0.001, ∗∗∗∗p ​< ​0.0001.
Fig. 4
Fig. 4
Semaglutide treatment modified the composition of gut microbiota in DM mice. (A) Venn diagrams of unique ASV in different groups. (B) α-diversity analysis. (C) β-diversity differences analysis. (D) PCoA analysis at the ASV level. (E) Relative abundance (%) at the family level in each group. (F) Main microbial composition of each group at the family level. (G) Clustering tree of LEfSe comparison from the domain to the genus level. (H) LDA analysis. (I) Relative abundance of representative gut microbiota at genus level. (J–K) Correlation analysis between gut microbiota and weight, RBG (J), and behavioral function (K), in impaired mice. (L) COG function classification. (n ​= ​8/group). Abbreviations: NC: normal control group; SE: normal control with semaglutide group; DM: Diabetes mellitus group; DM_SE: Diabetes mellitus with semaglutide group. Data are presented as mean ​± ​SD. ∗p ​< ​0.05, ∗∗p ​< ​0.01, ∗∗∗p ​< ​0.001, ∗∗∗∗p ​< ​0.0001.
Fig. 5
Fig. 5
Semaglutide treatment regulated differential microbial metabolites in feces. (A) PCA analysis of feces. OPLS-DA of feces between NC and DM groups (B), DM and DM_SE groups (C). NC and SE groups (D). (E) Venn analysis. VIP scores analysis of NC and DM (F), DM and DM_SE (G), NC and SE groups (H). (I) Selected potential metabolites biomarkers. (J) Bubble diagram of enriched KEGG pathways. (n ​= ​7–8/group). Abbreviations: NC: normal control group; SE: normal control with semaglutide group; DM: Diabetes mellitus group; DM_SE: Diabetes mellitus with semaglutide group. Data are presented as mean ​± ​SD. ∗p ​< ​0.05, ∗∗p ​< ​0.01, ∗∗∗p ​< ​0.001, ∗∗∗∗p ​< ​0.0001.
Fig. 6
Fig. 6
Semaglutide treatment regulated differential microbial metabolites in serum. (A) PCA analysis in serum. OPLS-DA in serum between NC and DM groups (B), DM and DM_SE groups (C), NC and SE groups (D). (E) Venn analysis. VIP score analysis of NC and DM (F), DM and DM_SE (G), NC and SE groups (H). (I) Selected potential metabolites biomarkers. (J) Bubble diagram of enriched KEGG pathways. (n ​= ​6–10/group). Abbreviations: NC: normal control group; SE: normal control with semaglutide group; DM: Diabetes mellitus group; DM_SE: Diabetes mellitus with semaglutide group. Data presented as mean ​± ​SD. ∗p ​< ​0.05, ∗∗p ​< ​0.01, ∗∗∗p ​< ​0.001, ∗∗∗∗p ​< ​0.0001.
Fig. 7
Fig. 7
Effect of semaglutide on brain transcriptome. (A) Venn analysis. (B) GO enrichment analysis of DEGs. (C) Reactome annotations analysis. (D–F) Volcano plots of significant DEGs for DM vs. NC (D), DM_SE vs. DM (E), and SE vs. NC (F). Red dots indicate upregulated genes; blue dots indicate downregulated genes. (G) Bubble diagram of KEGG enrichment analysis. (H–I) Circle diagram of KEGG enrichment analysis for DM vs. NC (H), DM_SE vs. DM (I), and SE vs. NC (J). (n ​= ​4/group). Abbreviations: NC: normal control group; SE: normal control with semaglutide group; DM: Diabetes mellitus group; DM_SE: Diabetes mellitus with semaglutide group.
Fig. 8
Fig. 8
Integration of correlation analysis for metabolites, microbes and genes. (A) Venn diagram of common significant KEGG enrichment pathways for blood metabolic profiles and DEGs. (B) Specific common significant KEGG enrichment pathways for blood metabolic profiles and DEGs. (C) Venn diagram of common significant KEGG enrichment pathways for feces metabolic profiles and DEGs. (D) Specific common significant KEGG enrichment pathways for blood metabolic profiles and DEGs. (E) Bubble diagram of KEGG enrichment analysis for blood and fecal metabolic profiles. (F) Heat map of DEGs involved in neuroactive ligand-receptor interaction. (G) Heat map of differential serum metabolites involved in neuroactive ligand-receptor interaction. (H) Heat map of differential fecal metabolites involved in neuroactive ligand-receptor interaction. (I) Spearman correlation analyses of DEGs and differential serum metabolites involved in neuroactive ligand-receptor interaction. (J) Spearman correlation analyses of DEGs and differential fecal metabolites involved in neuroactive ligand-receptor interaction. (K) Spearman correlation analysis of gut microbiota and DEGs involved in neuroactive ligand-receptor interaction. (L) Spearman correlation analysis of gut microbiota and differential serum metabolites involved in neuroactive ligand-receptor interaction. (M) Spearman correlation analysis of gut microbiota and differential fecal metabolites involved in neuroactive ligand-receptor interaction. Red indicates a positive correlation; blue indicates a negative correlation. Abbreviations: NC: normal control group; SE: normal control with semaglutide group; DM: Diabetes mellitus group; DM_SE: Diabetes mellitus with semaglutide group. ∗p ​< ​0.05, ∗∗p ​< ​0.01, ∗∗∗p ​< ​0.001, ∗∗∗∗p ​< ​0.0001.
Fig. 9
Fig. 9
Integrated multi-OMICs analysis of semaglutide treatment. (A) Diagnostic plot Samples were colored by grouping. The ellipse represents a 95 ​% confidence level ellipse plot. The number in the bottom left corner represents the correlation coefficient between the first principal component of each dataset. (B) Correlation Network Analysis showed correlations between selected signatures. The yellow, blue, and orange dots represent genes, metabolites, and microbes, respectively. The node size represents the magnitude of the central coefficient value, which is positively correlated. The thickness of the line indicates the magnitude of the correlation coefficient, with yellow indicating positive correlation and blue indicating negative correlation (C) The Circos plot shows positive (negative) correlations with a correlation cut-off (r ​= ​0.6), denoted by red (blue) lines, between selected signatures. (D) The clustered heatmap of selected signatures from each omics dataset. Rows represent samples, and columns represent features. Abbreviations: NC: normal control group; SE: normal control with semaglutide group; DM: Diabetes mellitus group; DM_SE: Diabetes mellitus with semaglutide group.

References

    1. Saeedi P., Petersohn I., Salpea P., Malanda B., Karuranga S., Unwin N., et al. Global and regional diabetes prevalence estimates for 2019 and projections for 2030 and 2045: results from the international diabetes federation diabetes atlas. Diabetes Res Clin Pract. 2019;157 9th edition. - PubMed
    1. Qiu C., Kivipelto M., von Strauss E. Epidemiology of Alzheimer's disease: occurrence, determinants, and strategies toward intervention. Dialogues Clin Neurosci. 2009;11(2):111–128. - PMC - PubMed
    1. Luo A., Xie Z., Wang Y., Wang X., Li S., Yan J., et al. Type 2 diabetes mellitus-associated cognitive dysfunction: advances in potential mechanisms and therapies. Neurosci Biobehav Rev. 2022;137 - PubMed
    1. Ye M., Liu Y., Wang F., Yang X., Yang X., Gao X., et al. Polysaccharide extracted from Sarcandra glabra residue attenuate cognitive impairment by regulating gut microbiota in diabetic mice. Int J Biol Macromol. 2024;270(Pt 1) - PubMed
    1. Morais L.H., Schreiber H.L., 4th, Mazmanian S.K. The gut microbiota-brain axis in behaviour and brain disorders. Nat Rev Microbiol. 2021;19(4):241–255. - PubMed

MeSH terms

LinkOut - more resources