. 2025 May 25;16(1):4854.
doi: 10.1038/s41467-025-59972-z.

CXCR4+ mammary gland macrophageal niche promotes tumor initiating cell activity and immune suppression during tumorigenesis

Affiliations

CXCR4+ mammary gland macrophageal niche promotes tumor initiating cell activity and immune suppression during tumorigenesis

Eunmi Lee et al. Nat Commun. .

Abstract

Tumor-initiating cells (TICs) share features and regulatory pathways with normal stem cells, yet how the stem cell niche contributes to tumorigenesis remains unclear. Here, we identify CXCR4+ macrophages as a niche population enriched in normal mammary ducts, where they promote the regenerative activity of basal cells in response to luminal cell-derived CXCL12. CXCL12 triggers AKT-mediated stabilization of β-catenin, which induces Wnt ligands and pro-migratory genes, enabling intraductal macrophage infiltration and supporting regenerative activity of basal cells. Notably, these same CXCR4+ niche macrophages regulate the tumor-initiating activity of various breast cancer subtypes by enhancing TIC survival and tumor-forming capacity, while promoting early immune evasion through regulatory T cell induction. Furthermore, a CXCR4+ niche macrophage gene signature correlates with poor prognosis in human breast cancer. These findings highlight the pivotal role of the CXCL12-CXCR4 axis in orchestrating interactions between niche macrophages, mammary epithelial cells, and immune cells, thereby establishing a supportive niche for both normal tissue regeneration and mammary tumor initiation.


Conflict of interest statement

Competing interests: Y.K. is a co-founder and chair of the Scientific Advisory Board of Firebrand Therapeutics, Inc. and Kayothera, Inc. The remaining authors declare no competing interests.

Figures
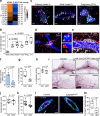
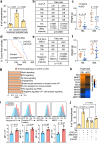
Fig. 1
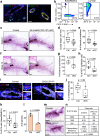
Fig. 1. Genetic depletion of CXCR4 in mammary gland macrophage inhibits mammary branching morphogenesis.
a Heatmap showing differentially expressed chemokine/cytokine receptor genes between mammary gland macrophages (M-Mϕ) and peritoneal macrophages (P-Mϕ), with fold changes indicated. b Percentage of F4/80+CXCR4+ Mϕ among CD11b+ cells (Supplementary Fig. 16b) in mammary glands from different stages (n  = 4, 5, 6, 9, biologically independent samples, Wks weeks, Preg. pregnancy, Inv. involution). c Immunofluorescence (IF) images of mammary gland at puberty (week 4), adult (week 9), and pregnancy (P14), stained for CXCR4 (green) and F4/80 (red). White arrows indicate double-positive cells. d, e Whole-mount mammary gland tissues from 8-week-old females stained for d Keratin 8 (K8, blue), F4/80 (red), and CXCR4 (green) or e Keratin 8 (K8, blue), F4/80 (red), and Collagen IV; Col IV (white). Enlarged views of boxed areas are shown. f qRT-PCR analysis of CXCR4 mRNA expression in Mϕ from LysM-Cre littermate control (Ctrl) and CXCR4Mϕ-cKO mice (cKO) (n = 3, biologically independent samples). g, h Flow cytometry quantification of F4/80+CXCR4+ Mϕ among CD11b+ cells (g) and F4/80+CXCR4 Mϕ among CD11b+ cells (h) (Supplementary Fig. 16b) in LysM-Cre littermate control and CXCR4Mϕ-cKO mice. F4/80CXCR4 and F4/80CXCR4+ cells among CD11b+ cells are excluded from the quantification graph (n = 4, biologically independent samples). i Representative images of carmine alum whole mount staining of mammary glands from control and CXCR4Mϕ-cKO mice (8 weeks). j, k Quantification of j ductal length (n = 6, biologically independent samples), k branching (n = 11, 12, biologically independent samples). l Ki67, K8 and K14 staining of control and CXCR4Mϕ-cKO mammary glands. m Quantification of Ki67+ cell percentage among total epithelial cells in the field of view (n = 6, biologically independent samples). Scale bar, 50 μm in (c, l), 100 μm in (d, e), and 25 μm in (i). Data are mean values  ±  s.d. Statistical significance was calculated by two-tailed unpaired Student’s t-test or one-way ANOVA with Turkey’s test. Box plots show the median (center line), 25th/75th percentiles (box bounds), whiskers extending to 1.5× IQR, and outliers plotted individually. Source data are provided as a Source Data file.
Fig. 2
Fig. 2. CXCR4 is critical for macrophage-mediated stem cell promoting activity.
a F4/80+ Mϕ among CD11b+ cells (Supplementary Fig. 16c) in control and CXCR4Mϕ-cKO mammary glands (n = 6, 7, biologically independent samples). b F4/80 and K8 IF staining of control and CXCR4Mϕ-cKO mammary glands. Enlarged views of boxed areas are shown. c Quantification of intraepithelial F4/80+ cells per field (n = 4, biologically independent samples, 3 ductal areas were randomly selected per each section). d Transwell migration assays of control and CXCR4Mϕ-cKO macrophages (n = 4, biologically independent samples, 5 microscopic fields were randomly selected from each well). e Heatmap of differentially expressed genes (DEGs) related to macrophage migration from RNA-seq of control and CXCR4Mϕ-cKO Mϕ. f Transwell migration of CXCR4+ and CXCR4 macrophages (n = 3, biologically independent samples, 5 microscopic fields were randomly selected). g Pathway enrichment analysis from DEGs in CXCR4+ vs. CXCR4 macrophages, highlighting migration/Chemotaxis pathways ranked by adjusted FDR. h Quantification of Lin-CD24+CD29Hi Basal/MaSCs (P4) cells (Supplementary Fig. 16a) from control and CXCR4Mϕ-cKO mammary glands (n = 7, biologically independent samples). i Mammosphere formation of 5000 P4 cells from control and CXCR4Mϕ-cKO mice (n = 3, biologically independent samples). j Limited dilution assay with P4 cells from control and CXCR4Mϕ-cKO mammary glands. Table representing serial dilution injections with the corresponding take rate and repopulation frequencies (calculated by ELDA, Pearson’s Chi-squared test, two-sided). k Representative Carmine alum-stained mammary outgrowths. l, m Mammosphere formation assay using 5000 P4 cells cocultured with l 20,000 Mϕ from control and CXCR4Mϕ-cKO, or m 20,000 CXCR4+ and CXCR4 Mϕ (n = 3, biologically independent). n Limited dilution assay of WT P4 injected into control and CXCR4Mϕ-cKO recipient mice; ductal branching quantified (n = 7, biologically independent samples). o Representative mammary outgrowths. Scale bar, 50 μm in (b) and 25 μm in (k) and (o). Data are mean values  ±  s.d. Statistical significance was calculated by two-tailed unpaired Student’s t-test or one-way ANOVA with Turkey’s test. Box plots show the median (center line), 25th/75th percentiles (box bounds), whiskers extending to 1.5× IQR, and outliers plotted individually. Source data are provided as a Source Data file.
Fig. 3
Fig. 3. CXCL12 is mainly produced by luminal epithelial cells and is required for mammary ductal morphogenesis.
a IF images of CXCL12 with Keratin 14 (K14) or Keratin 8 (K8) in WT mammary epithelium. b Representative flow cytometry plots showing CXCL12 protein and mRNA expression in basal/MaSCs and luminal cells. c, f Representative carmine alum-stained mammary glands from K8-CreER control (Ctrl) and CXCL12K8-cKO (cKO) mice at 6 and 14 weeks. d, e, and g Quantification of ductal length (d), and branching (e and g) in week 6 (n = 10, 14) and week 14 (n = 4, 6, biologically independent samples) mammary glands. h Quantification of Ki67+ epithelial cell in control vs. CXCL12K8-cKO mammary glands (n = 4, 5, biologically independent samples). i F4/80 and K8 IF staining of control and CXCL12K8-cKO mammary glands. Right panels show enlarged boxed regions. j Quantification of intraepithelial F4/80+ cell per field (n = 3, biologically independent samples, 2–3 ductal areas were randomly selected per each gland section for quantification). k Flow cytometry quantification of LinCD24+CD29Hi P4 cells (basal/MaSCs) (Supplementary Fig. 16a) in control and CXCL12K8-cKO mammary glands (n = 9, 11, biologically independent samples). l Mammosphere formation assay with 5000 P4 cell from control and CXCL12K8-cKO (n = 3, biologically independent samples). m, n Limited dilution assay with basal/MaSCs from control and CXCL12K8-cKO mammary glands. Representative mammary outgrowths. Table representing serial dilution injections with the corresponding take rate and repopulation frequencies (calculated by ELDA, Pearson’s Chi-squared test, two-sided). Scale bar, 50 μm (a and i), 25 μm (c, f, and m). Data are shown as mean values  ±  s.d. Statistical significance was calculated by two-tailed unpaired Student’s t-test or one-way ANOVA with Turkey’s test. Box plots show the median (center line), with box bounds representing the 25th and 75th percentiles (lower and upper quartiles). Whiskers extend to the most extreme values within 1.5x the interquartile range (IQR); points beyond this range are plotted as outliers. Source data are provided as a Source Data file.
Fig. 4
Fig. 4. CXCL12–CXCR4 axis induces AKT-mediated β-catenin activation in CXCR4+ mammary gland macrophages.
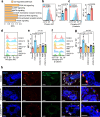
a Pathway enrichment analysis from differentially expressed genes in CXCL12-treated versus non-treated control Mϕ. b, c Flow cytometry histogram presentation of the expression and mean fluorescent intensity (MFI) of phosphorylated-AKT (b) and phosphorylated-β-catenin (Ser552) (c) in CXCR4+ and CXCR4 mammary gland macrophages (n = 4, 3, biologically independent samples). d, f Flow cytometry histogram presentation of the expression of phosphorylated-AKT (d) and phosphorylated-β-catenin (Ser552) (f) in mammary gland macrophages cultured in vitro with 200 ng/ml recombinant CXCL12 (rCXCL12), 10 μM AKT inhibitor, GSK690693 (GSK) and 10 μM CXCR4 inhibitor AMD3100 (AMD). e, g MFI of phosphorylated-AKT (e) and phosphorylated-β-catenin (Ser552) (g) in macrophages with different treatment conditions measured by flow cytometry analysis (n = 3, biologically independent samples). h IF co-staining of F4/80 with phosphorylated-β-catenin (Ser552) in littermate control, CXCL12K8-cKO and CXCR4Mϕ-cKO mammary glands. The enlargement of areas marked by dashed line boxes is shown on the right panels. White arrows indicated double-positive cells. Scale bar, 50 μm in (h). Flow cytometry analysis of Mϕ gate (Supplementary Fig. 16b) for MFI quantification in (bg). Data are presented as mean values  ±  s.d. Statistical significance was calculated by two-tailed unpaired Student’s t-test or one-way ANOVA with Turkey’s multiple comparisons test. Source data are provided as a Source Data file.
Fig. 5
Fig. 5. CXCL12/CXCR4–AKT–β-catenin signaling induces invasive and MaSC-promoting activity of CXCR4+ mammary gland macrophages.
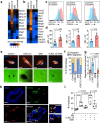
a, b Heatmaps showing differentially expressed genes related to Wnt/β-catenin pathways from RNA seq analysis of mammary gland-derived macrophages cultured with recombinant CXCL12 (rCXCL12) or AKT inhibitor GSK690693 (GSK), or both. c Flow cytometry histogram presentation of the expression of Wnt2b, CCND3, and MMP2 in CXCR4+ and CXCR4 mammary gland macrophages (Supplementary Fig. 16b). d MFI of Wnt2b, CCND3, and MMP2 in macrophages measured by flow cytometry analysis (n = 6, 3, 3 per each group, biologically independent samples). e Representative images of mammary gland-derived macrophages forming invadopodia stained with DAPI and Phalloidin (red), and images of fluorescein-gelatin (green—on the bottom) f, g Quantification of invadopodia formation ability measured by (f) the percentage of the macrophages that co-localize with degraded versus non-degraded gelatin area and (g) the size of gelatin degradation in a defined area (n = 5, biologically independent samples). h IF co-staining of F4/80 with Wnt2b in WT mammary glands. Enlargement of areas marked by dashed line boxes is shown at the right panels. i, Quantification of mammosphere formation assay with 5000 P4 cells from WT cocultured with 20,000 macrophages pre-treated with recombinant CXCL12 and AKT inhibitor (n = 5, biologically independent samples). Scale bar, 10 μm in (e) and 50 μm in (h). Data are presented as mean values  ±  s.d. Statistical significance was calculated by two-tailed unpaired Student’s t-test or one-way ANOVA with Turkey’s multiple comparisons test. Box plots show the median (center line), with box bounds representing the 25th and 75th percentiles (lower and upper quartiles). Whiskers extend to the most extreme values within 1.5× the interquartile range (IQR); points beyond this range are plotted as outliers. Source data are provided as a Source Data file.
Fig. 6
Fig. 6. Genetic depletion of CXCR4 in mammary gland macrophage inhibits mammary tumorigenesis.
a Representative flow cytometry plots showing the percentage of CXCR4+F4/80+ Mϕ among CD11b+ cells from the normal mammary gland (MG) from 8-week-old wild-type female mice, preneoplasia glands from 10-week-old PyMT mice, and tumors from 18-week-old PyMT mice. b The percentage of CXCR4+F4/80+CD11b+ Mϕ by flow cytometry analysis (Supplementary Fig. 16b) (n  = 4, biologically independent samples). c IF images of cells co-stained with antibodies against CXCR4 (green) and F4/80 (red) in preneoplasia glands from 10-week-old PyMT mice, and tumors from 14- and 18-week-old PyMT mice. White arrows indicated double-positive cells. The enlargement of areas is shown on the right panels. d Kinetics of mammary tumor onset in PyMT;control (n = 20) and PyMT;CXCR4Mϕ-cKO mice (n = 20) as shown by Kaplan–Meier plot. P value by two-tailed log-rank test and hazard ratio (HR) measured. e Primary tumor growth rate of PyMT;control (n = 9, Ctrl) and PyMT;CXCR4Mϕ-cKO (n = 9, cKO) mice. f The number of lung metastasis in PyMT;control (n = 9) and PyMT;CXCR4Mϕ-cKO (n = 9) mice. g Carmine alum whole mount staining of preneoplastic glands from PyMT;control and PyMT;CXCR4Mϕ-cKO mice at 10 weeks. h–j Quantification of flow cytometry analysis (Supplementary Fig. 16a) showing the percentage of LinCD24+CD29lowCD61+ cells (luminal progenitor, LP) (h), LinCD24+CD29lo luminal cells (i), and LinCD24+CD29Hi basal/MaSCs (j) from PyMT;control and PyMT;CXCR4Mϕ-cKO preneoplasia glands (n = 4,5 per each group, biologically independent samples). Scale bar, 50 μm in (c) and 25 μm in (g). Data are presented as mean values  ±  s.d. Statistical significance was calculated by two-tailed unpaired Student’s t-test or one-way ANOVA with Turkey’s multiple comparisons test. Box plots show the median (center line), with box bounds representing the 25th and 75th percentiles (lower and upper quartiles). Whiskers extend to the most extreme values within 1.5× the interquartile range (IQR); points beyond this range are plotted as outliers. Source data are provided as a Source Data file.
Fig. 7
Fig. 7. Genetic depletion of CXCR4 in mammary gland macrophages inhibits TIC activity.
a Tumorsphere formation assay using 5000 MECs co-cultured with and without 20,000 CXCR4+ and CXCR4 macrophages from PyMT control preneoplastic glands (n = 3, biologically independent samples). b Limited dilution tumorigenesis assay with luminal progenitor (LP) cells from PyMT preneoplastic glands injected into LysM-Cre control (Ctrl) and CXCR4Mϕ-cKO (cKO) recipient mice. Table representing serial dilution injections with the corresponding take rate and repopulation frequencies (calculated by ELDA, Pearson’s Chi-squared test, two-sided). c Tumor weights from PyMT LPs injected into LysM-Cre control (n = 8) or CXCR4Mϕ-cKO recipients (n = 8). d Kaplan–Meier curve showing tumor onset in MMTV-Wnt control (n = 13) and MMTV-WntT;CXCR4Mϕ-cKO (n = 13) mice; log-rank p-value and hazard ratio (HR) shown. e Limited dilution tumorigenesis assay using MECs from MMTV-Wnt preneoplastic glands injected into control and CXCR4Mϕ-cKO mice. Table representing serial dilution injections with the corresponding take rate and repopulation frequencies (calculated by ELDA, Pearson’s Chi-squared test, two-sided). f Tumor weights from MMTV-Wnt MECs injected into control (n = 8) or CXCR4Mϕ-cKO recipient (n = 8) mice. g GSEA of pathways enriched in Mϕ from PyMT control vs. PyMT;CXCR4Mϕ-cKO mice. h Heatmap of differentially expressed Notch/Wnt-related genes from RNA-seq of PyMT control and PyMT;CXCR4Mϕ-cKO Mϕ. i Flow cytometry histograms showing expression and MFI of pAKT, p-β-catenin (Ser552), WNT2B, and MMP2 in CXCR4+ vs. CXCR4- PyMT preneoplastic gland Mϕ (Supplementary Fig. 16b) (n = 3, biologically independent samples). j Tumorsphere assay using 5000 MECs co-cultured with 20,000 Mϕ pre-treated with rCXCL12 (200 ng/ml), AMD3100 (10 μM), AKT inhibitor GSK690693 (GSK, 10 μM), or Wnt inhibitor, ICG-001 (20μM) (n = 3, biologically independent samples). Data are mean values  ±  s.d. Statistical analysis by two-tailed unpaired Student’s t-test or one-way ANOVA with Turkey’s test. Box plots show the median (center line), 25th/75th percentiles (box bounds), whiskers extending to 1.5× IQR, and outliers plotted individually. Source data are provided as a Source Data file.
Fig. 8
Fig. 8. CXCR4+ macrophages form an immune suppressive niche via Treg induction and are associated with poor prognosis in breast cancer patients.
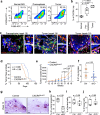
a UMAP visualization of T cell subclusters colored by cell type. b Bar plot showing the relative abundance of each T cell subcluster in PyMT;control vs. PyMT;CXCR4Mϕ-cKO groups. c Representative flow cytometry of FOXP3+CD25+ among CD4+ cells (Regulatory T cell, Tregs) from preneoplastic glands. d, Quantification of FOXP3+CD25+CD4+ Tregs by flow cytometry (n = 3, biologically independent samples). e CD45+CD8+ T cells in PyMT;control vs. PyMT;CXCR4Mϕ-cKO glands (n = 4, 5, biologically independent samples). f Volcano plot of differentially expressed genes in CD8 T2 cluster from PyMT;control or PyMT;CXCR4Mϕ-cKO. Each dot represents a gene. Genes with absolute average log2 fold change > 0.5 and adjusted p < 0.05 are highlighted in colors. Representative upregulated genes in the cKO group are labeled. g The percentage of FOXP3+CD25+CD4+ Tregs differentiated from naïve T cells in vitro by co-culturing of macrophages isolated from PyMT;control and PyMT;CXCR4Mϕ-cKO preneoplasia glands assessed by flow cytometry analysis (n = 4 in each group, biologically independent samples). h Percentage of FOXP3+CD25+CD4+ Tregs differentiated from naïve T cells in vitro by co-culturing of CXCR4+ and CXCR4- macrophages (n  = 4, biologically independent samples). i Kaplan–Meier curve showing tumor onset in control (n = 30) and AMD3100 (n = 30) treated PyMT mice; two-tailed log-rank p-value and hazard ratio (HR). j Primary tumor growth in control (n = 13) and AMD3100-treated (n = 17) PyMT mice. k Quantification of lung metastases in the same groups as (j). l Kaplan–Meier survival analysis of breast cancer patients with all type or luminal B, HER2-positive, and basal subtype stratified by a 30-gene CXCR4+Mϕ signature derived from bulk RNA-seq of PyMT;control vs. PyMT;CXCR4Mϕ-cKO preneoplasia glands. P value by two-tailed log-rank test and hazard ratio (HR) measured. Flow cytometry analysis of Tregs and CD8 T cells (Supplementary Fig. 16b) in (ce, g, and h). Data are mean values  ±  s.d. Statistical significance calculated by two-tailed unpaired Student’s t-test or one-way ANOVA with Turkey’s test. Box plots show the median (center line), 25th/75th percentiles (box bounds), whiskers extending to 1.5× IQR, and outliers plotted individually. Source data are provided as a Source Data file.

References

    1. Liu, X., Li, W., Fu, X. & Xu, Y. The immunogenicity and immune tolerance of pluripotent stem cell derivatives. Front. Immunol.8, 645 (2017). - PMC - PubMed
    1. Magee, J. A., Piskounova, E. & Morrison, S. J. Cancer stem cells: impact, heterogeneity, and uncertainty. Cancer Cell21, 283–296 (2012). - PMC - PubMed
    1. Clarke, M. F. et al. Cancer stem cells-perspectives on current status and future directions: AACR Workshop on cancer stem cells. Cancer Res.66, 9339–9344 (2006). - PubMed
    1. Kreso, A. & Dick, J. E. Evolution of the cancer stem cell model. Cell Stem Cell14, 275–291 (2014). - PubMed
    1. Nguyen, L. V., Vanner, R., Dirks, P. & Eaves, C. J. Cancer stem cells: an evolving concept. Nat. Rev. Cancer12, 133–143 (2012). - PubMed

MeSH terms

LinkOut - more resources