. 2025 May 24;16(1):4833.
doi: 10.1038/s41467-025-60019-6.

Efficacy of JAK1/2 inhibition in murine myeloproliferative neoplasms is not mediated by targeting oncogenic signaling

Affiliations

Efficacy of JAK1/2 inhibition in murine myeloproliferative neoplasms is not mediated by targeting oncogenic signaling

Sivahari Prasad Gorantla et al. Nat Commun. .

Abstract

Ruxolitinib is a potent JAK1/JAK2 inhibitor, approved for the treatment of primary myelofibrosis (PMF) patients based on the concept of inhibition of oncogenic signaling. However, the effect of ruxolitinib on JAK2-V617F allelic burden is modest, suggesting that inhibition of JAK2-V617F signaling-driven clone expansion is not the main mechanism of action. We evaluate whether ruxolitinib mainly blocks the proliferation of the malignant clone or exerts its effects also by targeting non-malignant cells. Therefore, we develop two JAK2-V617F-driven myeloproliferative neoplasm (MPN) mouse models harboring ruxolitinib resistance mutations. Mice carrying ruxolitinib-resistant JAK2-V617F-driven MPN respond to ruxolitinib treatment similar to mice with ruxolitinib-sensitive JAK2-V617F MPN with respect to reduction of spleen size, leukocyte count and pro-inflammatory cytokines in the serum. Ruxolitinib reduces pro-inflammatory cytokines in both stromal cells and non-malignant hematopoietic cells. Using a rigorous ruxolitinib resistance mutation approach, we can prove that ruxolitinib acts independent of oncogenic JAK2-V617F signaling and reduces the main features of MPN disease such as spleen size and leukocyte counts. Our findings characterize the mechanism of action for ruxolitinib in MPN.


Conflict of interest statement

Competing interests: The authors declare no competing interests.

Figures

Fig. 1
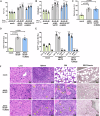
Fig. 1. A chemical mutagenesis screen identifies of ruxolitinib resistant JAK2 mutations L902Q and L983F.
A Immunoblot analysis of JAK2-V617F and JAK2V617F + L902Q expressing Ba/F3 cells in presence of indicated concentrations of ruxolitinib. The samples derive from the same experiment but different gels for pJAK2, total JAK2, HSP90, another for pSTAT5, total STAT5 were processed in parallel. Uncropped images are provided as a source data file. B MTT incorporation assay of JAK2-V617F and JAK2V617F + L902Q expressing Ba/F3 cells in presence of indicated ruxolitinib concentrations. Data represent mean ± SEM. Three independent experiments were performed. One representative experiment (n = 3) was shown. C MTT incorporation assay of JAK2-V617F, JAK2V617F + L902Q, and JAK2-V617F + L983F expressing Ba/F3 cells in presence of indicated ruxolitinib concentrations. Data represent mean ± SEM. Three independent experiments were performed. One representative (n = 3 technical replicates) experiment was shown. D Immunoblot analysis (n = 2) of JAK2-V617F, JAK2V617F + L902Q and JAK2-V617F + L983F expressing Ba/F3 cells in presence of indicated concentrations of ruxolitinib. The samples derive from the same experiment but different gels for pSTAT5, total STAT5, another for JAK” and β-actin were processed in parallel. Uncropped images are provided as a Source Data file. E The binding of ruxolitinib to the JH1 domain of JAK2 kinase was modeled using the SwissDock tool to understand the structural consequences of mutations conferring resistance to ruxolitinib. Ruxolitinib fits well into the ATP-binding pocket of JAK2 WT. 91% of its solvent accessible surface area is buried in the complex. The drug is held by numerous hydrophobic interactions with residues Leu 855, Val 863, Ala 880, Val 911, Met 929, Leu 932 and Leu 983 that line the binding pocket. Leu 902 does not directly interact with ruxolitinib, however it is close to the binding pocket and its mutation to Gln with a polar side chain significantly disturbs the binding of the inhibitor. While it is still almost completely buried, the propanenitrile and cyclopentyl moieties essentially exchange their positions leading to unfavorable interactions between the Asp 994 side chain and the cyclopentyl ring.
Fig. 2
Fig. 2. JAK2-V617F + L902Q mice display MPN phenotype and myelofibrosis similar to JAK2-V617F mice.
AD JAK2-V617F + L902Q mice (n = 6) display increased A hematocrit value (HCT). Data represent mean ± SEM. P value was calculated using two-way ANOVA test. (****p < 0.0001 mock vs JAK2-V617F mice at day 20, 40, and 60). (****p < 0.0001 mock vs JAK2-V617F + L902Q mice at day 20, 40 and 60). B Hemoglobin levels (HGB), Data represent mean ± SEM. P value was calculated using two-way ANOVA test. (***p = 0.0009 mock vs JAK2-V617F mice at day 20), (****p < 0.0001 mock vs JAK2-V617F mice at day 40 and 60). (**p = 0.0068 mock vs JAK2-V617F + L902Q mice at day 20), (****p < 0.0001 mock vs JAK2-V617F + L902Q mice at day 40 and 60). C Reticulocyte percentage. Data represent mean ± SEM. P value was calculated using one-way ANOVA test. D Spleen weight compared to empty vector (mock) transplanted mice (n = 6), similar to JAK2-V617F mice (n = 5). Data represent mean ± SEM. P value was calculated using one-way ANOVA test. E Flow cytometric analysis of BM lineage composition at day 60 showing increased percentage of EGFP+ CD11b+ and Gr-1+ cells in JAK2-V617F (n = 5) and JAK2-V617F + L902Q mice (n = 6) compared to mock mice (n = 5). Data represent mean ± SEM. P value was calculated using two-way ANOVA test. ****p < 0.0001 mock CD11b vs JAK2-V617F and ****p < 0.0001 mock CD11b vs JAK2-V617F + L902Q; ****p < 0.0001 mock Gr-1 vs JAK2-V617F and ****p < 0.0001 mock Gr-1 vs JAK2-V617F + L902Q; ****p < 0.0001 mock B220 vs JAK2-V617F and ****p < 0.0001 mock B220 vs JAK2-V617F + L902Q. n.s: non-significant p = 0.9681 in mock Thy1.2 versus JAK2-V617F and p = 0.8474 mock Thy1.2 vs JAK2-V617F + L902Q; F Histopathologic H&E stainings of liver, spleen and BM from JAK2-V617F and JAK2-V617F + L902Q mice reveal hyperplastic, left-shifted myelopoiesis granulopoiesis (G), erythropoiesis (E), and moderately increased megakaryopoiesis (M) in bone marrow. Gomori reticular fiber staining shows marked myelofibrosis. Note the extramedullary hematopoiesis in liver and spleen secondary to BM myelofibrosis. In contrast the mock animal shows normal liver, spleen and BM. (all figures 400x). Source data is provided in the Source Data file.
Fig. 3
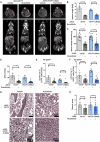
Fig. 3. Ruxolitinib treatment decreases spleen size and WBC in ruxolitinib sensitive and resistant JAK2-V617F transplanted mice.
A Representative CT scan images from JAK2-V617F and JAK2-V617F-L902Q mice treated with vehicle or ruxolitinib. Red borders indicate spleen size. B Statistical analysis of spleen length determined by CT scan imaging from JAK2-V617F and JAK2-V617F + L902Q mice treated with vehicle (n = 3/4, respectively) or ruxolitinib (n = 4). Data represent mean ± SEM. P value was calculated using two-tailed Student’s t test. C Ruxolitinib treatment (n = 16) reduces spleen weight of both JAK2-V617F and JAK2-V617F + L902Q mice at day 60, compared to vehicle treated mice (n = 9). Data represent mean ± SEM. P value was calculated using two-tailed Student’s t test. D Statistical analysis of WBC at day 60 from JAK2-V617F and JAK2-V617F + L902Q mice treated with vehicle (n = 8/9, respectively) or ruxolitinib (n = 18). Data represent mean ± SEM. P value was calculated using two-tailed Student’s t test. (E + F) Flow cytometric analysis of E EGFP+ and F EGFP- CD11b+/Gr-1+ cells in peripheral blood (PB) of JAK2-V617F and JAK2-V617F + L902Q mice treated with vehicle (n = 6/7 respectively) or ruxolitinib (n = 18/15, respectively). Data represent mean ± SEM. P value was calculated using two-tailed Student’s t test. G Representative Gomori staining images showing reduced myelofibrosis in ruxolitinib treated animals. H Histopathologic scoring of fibrosis in JAK2-V617F (n = 3) and JAK2-V617F + L902Q mice (n = 3) shows slight reduction of fibrosis in ruxolitinib vs. vehicle treated animals. Data represent mean ± SEM. P value was calculated using two-tailed Student’s t test. Source data is provided in the Source Data file.
Fig. 4
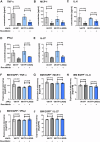
Fig. 4. Ruxolitinib treatment decreases inflammatory cytokine levels in sera of ruxolitinib sensitive and resistant JAK2-V617F transplanted mice.
Serum levels of tumor necrosis factor alpha (TNF-α) (A), interleukin-6 (IL-6) (B), monocyte chemoattractant protein 1 (MCP-1)/chemokine (C-C motif) ligand 2 (CCL2) (C), interferon-beta (IFN-β) (D), and interleukin-27 (E) determined in ruxolitinib vs. vehicle treated JAK2-V617F and JAK2-V617F + L902Q mice (n = 5). Data represent mean ± SEM. P value was calculated using two-tailed Student’s t test. FJ CD11b+ granulocytes of EGFP+ cells from bone marrow of JAK2-V617F and JAK2-V617F + L902Q mice were isolated from vehicle and ruxolitinib treated groups. Microarray analysis was performed on these cells for cytokine landscape. Inflammatory cytokines such as of tumor necrosis factor alpha (TNF-α) (F), IL-6 (G), MCP-1/CCL2 (H), IFN-β (I), and IL-27 (J) were depicted from bone marrow (BM) compartment of the ruxolitinib (n = 4) vs. vehicle (n = 3) treated JAK2-V617F and JAK2-V617F + L902Q mice. Data represent mean ± SEM. Adjusted p value based on Benjamini-Hochberg Step-Up FDR-controlling Procedure. Source data is provided in the Source Data file.
Fig. 5
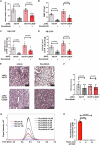
Fig. 5. Ruxolitinib treatment decreases spleen size and WBC in a highly ruxolitinib resistant JAK2-V617F + L983F mouse model.
Decreased A spleen weight and B white blood cells (WBC) in ruxolitinib vs. vehicle treated JAK2-V617F (n = 3) and JAK2-V617F + L983F mice (n = 5/8, respectively). Data represent mean ± SEM. P value was calculated using two-tailed Student’s t test. Decreased EYFP+ (C) and EYFP (D) CD11b+/ Gr-1+ cells in ruxolitinib vs. vehicle treated JAK2-V617F (n = 3) and JAK2-V617F + L983F mice (n = 5/8, respectively). Data represent mean ± SEM. P value was calculated using two-tailed Student’s t test. E Representative Gomori staining images showing reduced myelofibrosis in ruxolitinib treated JAK2-V617F and JAK2-V617F + L983F animals compared to vehicle. F Histopathologic scoring of fibrosis in JAK2-V617F (n = 3) and JAK2-V617F + L983F (n = 4 for vehicle, n = 5 for ruxolitinib treatment) mice shows slight reduction of fibrosis in ruxolitinib vs. vehicle treated animals. Data represent mean ± SEM. P value was calculated using two-tailed Student’s t test. G Representative mass spectrometry analysis of three independent mouse serum samples (n = 3) at the indicated time points after oral gavage of 60 mg/kg ruxolitinib. Ruxolitinib standards were included at concentrations from 16 µM to 0.5 µM. H Statistical analysis of mass spectrometric measurements of three independent mice (n = 3) of ruxolitinib serum concentration at the indicated time points after oral gavage. At the 3-h time point, a maximum concentration of 4.56 µM was detected. Data represent mean ± SEM. P value was calculated using one-way ANOVA test. Source data is provided in the Source Data file.
Fig. 6
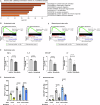
Fig. 6. Ruxolitinib treatment impairs inflammatory cytokine production in bone marrow stroma cells from JAK2-V617F mice.
A Metascape analysis of gene sets significantly enriched in stroma samples from vehicle (n = 10) vs. ruxolitinib (n = 10) treated JAK2-V617F mice. The top 8 gene sets are depicted. B Gene set enrichment analysis (GSEA) of endothelial cells from vehicle (n = 5) vs. ruxolitinib (n = 6) treated JAK2-V617F mice for the gene sets gene ontology (GO): inflammatory response and GO: cytokine production. C Gene set enrichment analysis (GSEA) of mesenchymal stem cells from vehicle (n = 5) vs. ruxolitinib (n = 4) treated JAK2-V617F mice for the gene sets GO: inflammatory response and GO: cytokine production. B, C False detection rate (FDR), q value and nominal p value were calculated using the Broad institute GSEA tool. Statistical analyses were performed by one-sided, Kolmogorov-Smirnov (KS)-like test to determine if genes in a given set are enriched at the top or bottom of a ranked list. D Expression of tumor necrosis factor alpha (TNF-α), interleukin-6 (IL-6), granulocyte-macrophage colony stimulating factor (GM-CSF), and leukemia inhibiting factor (LIF) in endothelial cells from ruxolitinib (n = 6) vs. vehicle (n = 5) treated JAK2-V617F mice as detected by microarray assay. Data represent mean ± SEM. P value was calculated using two-tailed Student’s t test. Intracellular FACS analysis of E TNF-α+ and F GM-CSF+ bone marrow stromal endothelial cells from ruxolitinib (n = 3) vs. vehicle (n = 3/4) treated empty vector, JAK2-V617F and JAK2-V617F + L902Q mice as detected by microarray assay. Data represent mean ± SEM. P value was calculated using two-tailed Student’s t test. Source data is provided in the Source Data file.
Fig. 7
Fig. 7. Itacitinib treatment does not attenuate disease phenotype in the ruxolitinib sensitive or resistant mouse model.
While ruxolitinib treatment reduced white blood cell (WBC) count (A), spleen weight (B) and length (C) and total numbers of myeloid cells (D) in both the ruxolitinib sensitive JAK2-V617F and ruxolitinib resistant JAK2-V617F + L902Q, itacitinib did not show any effects (n = 3 vs. 4 vs. 3 animals per treatment for each JAK2 mutation). Data represent mean ± SEM. P value was calculated using two-tailed Student’s t test. In contrast to ruxolitinib, itacitinib neither decreased EGFP+ (E) or EGFP (F) CD11b+/Gr-1+ cells. (n = 3 vs. 4 vs. 3 animals per treatment for each JAK2 mutation). Data represent mean ± SEM. P value was calculated using two-tailed Student’s t test. Source data is provided in the Source Data file.

References

    1. Parganas, E. et al. Jak2 is essential for signaling through a variety of cytokine receptors. Cell93, 385–395 (1998). - PubMed
    1. Neubauer, H. et al. Jak2 deficiency defines an essential developmental checkpoint in definitive hematopoiesis. Cell93, 397–409 (1998). - PubMed
    1. James, C. et al. A unique clonal JAK2 mutation leading to constitutive signalling causes polycythaemia vera. Nature434, 1144–1148 (2005). - PubMed
    1. Levine, R. L. et al. The JAK2V617F activating mutation occurs in chronic myelomonocytic leukemia and acute myeloid leukemia, but not in acute lymphoblastic leukemia or chronic lymphocytic leukemia. Blood106, 3377–3379 (2005). - PMC - PubMed
    1. Baxter, E. J. et al. Acquired mutation of the tyrosine kinase JAK2 in human myeloproliferative disorders. Lancet365, 1054–1061 (2005). - PubMed

MeSH terms

LinkOut - more resources