. 2025 May 25;16(1):4852.
doi: 10.1038/s41467-025-59979-6.

Analysis of more than 400,000 women provides case-control evidence for BRCA1 and BRCA2 variant classification

Maria Zanti #  1 Denise G O'Mahony #  1   2 Michael T Parsons  3 Leila Dorling  4 Joe Dennis  4 Nicholas J Boddicker  5 Wenan Chen  5 Chunling Hu  6 Marc Naven  4 Kristia Yiangou  1 Thomas U Ahearn  7 Christine B Ambrosone  8 Irene L Andrulis  9   10 Antonis C Antoniou  4 Paul L Auer  11 Caroline Baynes  12 Clara Bodelon  13 Natalia V Bogdanova  14 Stig E Bojesen  15   16   17 Manjeet K Bolla  4 Kristen D Brantley  18 Nicola J Camp  19 Archie Campbell  20 Jose E Castelao  21 Melissa H Cessna  22 Jenny Chang-Claude  23   24 Fei Chen  25 Georgia Chenevix-Trench  26 NBCS CollaboratorsDon M Conroy  12 Kamila Czene  27 Arcangela De Nicolo  28   29 Susan M Domchek  30 Thilo Dörk  31 Alison M Dunning  12 A Heather Eliassen  32   33 D Gareth Evans  34   35 Peter A Fasching  36 Jonine D Figueroa  7   37   38 Henrik Flyger  39 Manuela Gago-Dominguez  40 Montserrat García-Closas  7 Gord Glendon  9 Anna González-Neira  41 Felix Grassmann  42 Andreas Hadjisavvas  43 Christopher A Haiman  25 Ute Hamann  44 Steven N Hart  6 Mikael B A Hartman  45   46   47 Weang-Kee Ho  48   49 James M Hodge  13 Reiner Hoppe  50   51 Sacha J Howell  52 kConFab InvestigatorsAnna Jakubowska  53   54 Elza K Khusnutdinova  55   56 Yon-Dschun Ko  57 Peter Kraft  58 Vessela N Kristensen  59   60 James V Lacey  61   62 Jingmei Li  63 Geok Hoon Lim  64   65 Sara Lindström  66   67 Artitaya Lophatananon  68 Craig Luccarini  12 Arto Mannermaa  69   70   71 Maria Elena Martinez  72   73 Dimitrios Mavroudis  74 Roger L Milne  75   76   77 Kenneth Muir  68 Katherine L Nathanson  30 Rocio Nuñez-Torres  41 Nadia Obi  78   79 Janet E Olson  80 Julie R Palmer  81   82 Mihalis I Panayiotidis  43   83 Alpa V Patel  13 Paul D P Pharoah  84 Eric C Polley  85 Muhammad U Rashid  44   86 Kathryn J Ruddy  87 Emmanouil Saloustros  88 Elinor J Sawyer  89 Marjanka K Schmidt  90   91   92 Melissa C Southey  75   77   93 Veronique Kiak-Mien Tan  65   94   95   96 Soo Hwang Teo  97   98 Lauren R Teras  13 Diana Torres  44   99 Amy Trentham-Dietz  100 Thérèse Truong  101 Celine M Vachon  80 Qin Wang  4 Jeffrey N Weitzel  102 Siddhartha Yadav  87 Song Yao  8 Gary R Zirpoli  81 Melissa S Cline  103 Peter Devilee  104   105 Sean V Tavtigian  106   107 David E Goldgar  108 Fergus J Couch  6 Douglas F Easton  4   12 Amanda B Spurdle  3 Kyriaki Michailidou  109
Collaborators, Affiliations

Analysis of more than 400,000 women provides case-control evidence for BRCA1 and BRCA2 variant classification

Maria Zanti et al. Nat Commun. .

Abstract

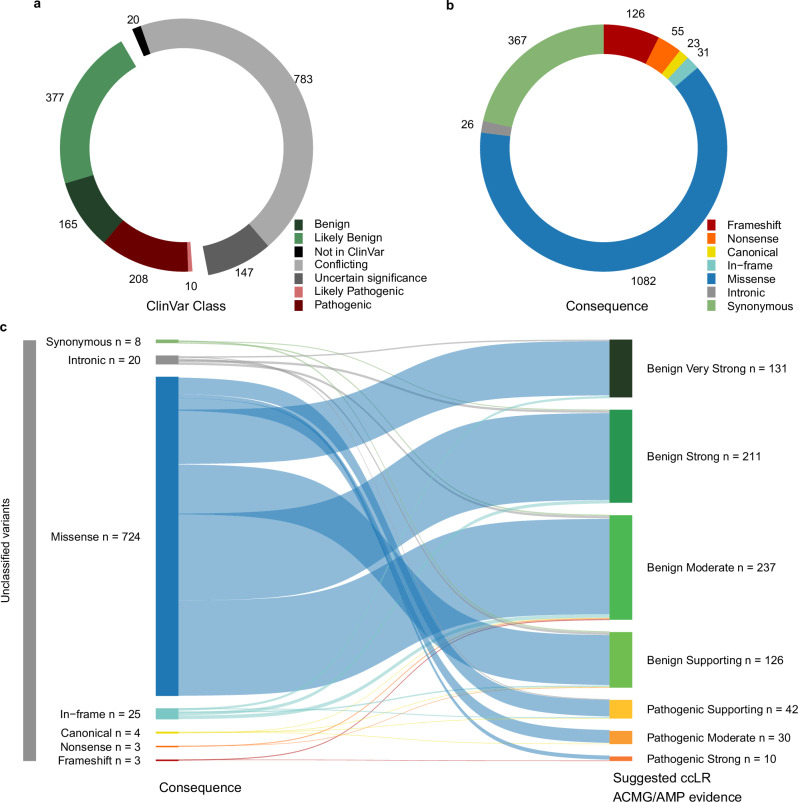
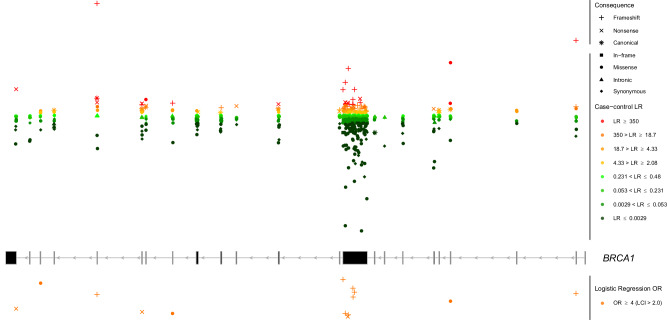
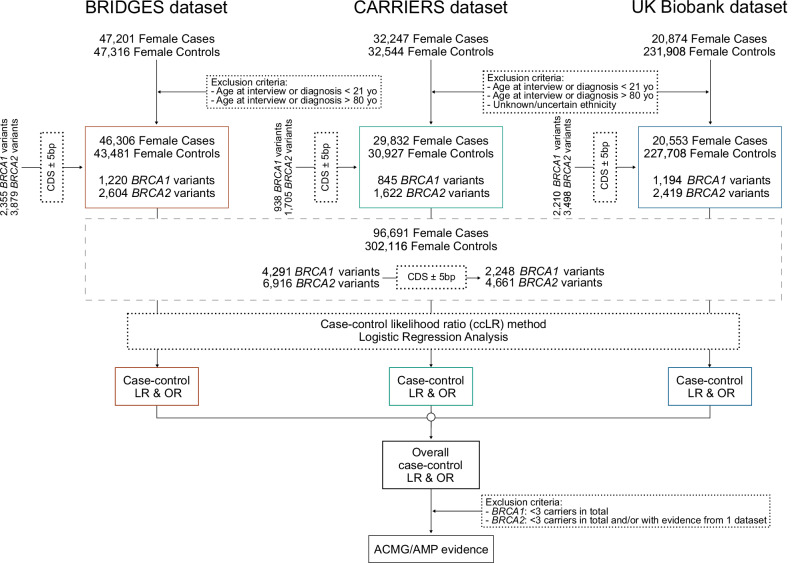
Clinical genetic testing identifies variants causal for hereditary cancer, information that is used for risk assessment and clinical management. Unfortunately, some variants identified are of uncertain clinical significance (VUS), complicating patient management. Case-control data is one evidence type used to classify VUS. As an initiative of the Evidence-based Network for the Interpretation of Germline Mutant Alleles (ENIGMA) Analytical Working Group we analyze germline sequencing data of BRCA1 and BRCA2 from 96,691 female breast cancer cases and 302,116 controls from three studies: the BRIDGES study of the Breast Cancer Association Consortium, the Cancer Risk Estimates Related to Susceptibility consortium, and the UK Biobank. We observe 11,207 BRCA1 and BRCA2 variants, with 6909 being coding, covering 23.4% of BRCA1 and BRCA2 VUS in ClinVar and 19.2% of ClinVar curated (likely) benign or pathogenic variants. Case-control likelihood ratio (ccLR) evidence is highly consistent with ClinVar assertions for (likely) benign or pathogenic variants; exhibiting 99.1% sensitivity and 95.3% specificity for BRCA1 and 93.3% sensitivity and 86.6% specificity for BRCA2. This approach provides case-control evidence for 787 unclassified variants; these include 579 with strong or moderate benign evidence and 10 with strong pathogenic evidence for which ccLR evidence is sufficient to alter clinical classification.


Conflict of interest statement

Competing interests: The following authors declare conflicts not directly relevant to this work as stated below. VK-MT and GDE have received consultancies from AstraZeneca and Everything Genetic Ltd. ACA and DFE are named creators of the BOADICEA model, which has been licensed by Cambridge Enterprise (University of Cambridge). SJH has received speaker fees from AstraZeneca and Pfizer Ltd. SY has received research funding from AstraZeneca and Repare Therapeutics and participates in the advisory board for AstraZeneca. JWW has received consulting fees from Natera, MyOme, Cancer IQ, equity from Natera, and speaker fees from AstraZeneca. All the other authors declare no competing interests.

Figures

Fig. 1
Fig. 1. Overview of BRCA1 and BRCA2 variants with case-control likelihood ratio evidence.
Donut plots showing the distribution of the a clinical classification (“ClinVar Class”) and b sequence ontology variant consequence (“Consequence”) for the 1717 CDS ± 5 bp variants with filtering allele frequency (FAF) > 0.001 (i.e., variants not meeting the BRCA1 and BRCA2 VCEP “BA1” benign stand-alone criterion), present in at least three individuals in the combined dataset, and with evidence from at least two datasets for BRCA2. The clinical classification status (“ClinVar Class”) of variants was retrieved from the ClinVar database (last accessed on January 7, 2024). c Sankey plot depicting “suggested case-control likelihood ratio (ccLR) ACMG/AMP evidence” (excluding variants with a ccLR of “No evidence”) provided for unclassified variants (i.e., variants not reported in ClinVar or listed in ClinVar as VUS, variants of conflicting classifications of pathogenicity or variants with classification “not provided”), per sequence ontology variant consequence (“Consequence”).
Fig. 2
Fig. 2. Genomic mapping of the case-control analysis for BRCA1.
Overlay of the case-control likelihood ratios (LRs) and the logistic regression odds ratio (OR) estimates is represented within each exon (middle panel). Exons are sequentially numbered from 1 to 23 and annotated from right to left to match the MANE Select transcripts. Although BRCA1 was initially described with 24 exons (GenBank Accession ID U14680.1), exon 4 is missing following further assessment of the gene. We implement the most updated version of exon numbering (excluding legacy exon numbering). Case-control LRs (top panel) are represented on a continuous log2-transformed y axis with axis breaks. For the case-control LR analysis, the red color gradient represents LR reaching suggested ACMG/AMP evidence in favor of pathogenicity with strength levels ranging from very strong (dark red) to supporting (yellow). The green color gradient represents LR reaching ACMG/AMP evidence against pathogenicity with strength levels ranging from very strong (dark green) to supporting (light green). Variants with LR of “No evidence” are not plotted. For the logistic regression analysis (bottom panel), orange color represents OR estimates reaching the strong PS4 criterion (OR ≥ 4.0, P value < 0.05, and confidence interval (CI) not including 2.0). Variants with OR estimates not reaching the PS4 criterion are not plotted. Associations were adjusted for age and study country (BCAC dataset), age and ethnic group (CARRIERS dataset), and age and genetic ancestry (UKB dataset). Only variants present in both cases and controls were analyzed. ORs with 95% CIs were estimated for each dataset and combined using a fixed-effects, inverse-variance meta-analysis in the ‘metafor’ R package to derive an overall test of association. A two-sided likelihood ratio test (LRT) was used to calculate P-values. No adjustments were made for multiple comparisons. For visualization purposes, the y-axis for logistic regression is represented in reverse order. LCI, lower confidence interval. Sequence ontology variant consequence (“Consequence”) is represented with different symbols.
Fig. 3
Fig. 3. Genomic mapping of the case-control analysis for BRCA2.
Overlay of the case-control likelihood ratios (LRs) and the logistic regression odds ratio (OR) estimates is represented within each exon (middle panel). Exons are sequentially numbered from 1 to 27 and annotated from left to right to match the MANE Select transcripts. Case-control LRs (top panel) are represented on a continuous log2-transformed y axis with axis breaks. For the case-control LR analysis, the red color gradient represents LR reaching suggested ACMG/AMP evidence in favor of pathogenicity with strength levels ranging from very strong (dark red) to supporting (yellow). The green color gradient represents LR reaching ACMG/AMP evidence against pathogenicity with strength levels ranging from very strong (dark green) to supporting (light green). Variants with an LR of “No evidence” are not plotted. For the logistic regression analysis (bottom panel), orange color represents OR estimates reaching the strong PS4 criterion (OR ≥ 4.0, P value < 0.05, and confidence interval (CI) not including 2.0). Variants with OR estimates not reaching the PS4 criterion are not plotted. Associations were adjusted for age and study country (BCAC dataset), age and ethnic group (CARRIERS dataset), and age and genetic ancestry (UKB dataset). Only variants present in both cases and controls were analyzed. ORs with 95% CIs were estimated for each dataset and combined using a fixed-effects, inverse-variance meta-analysis in the ‘metafor’ R package to derive an overall test of association. A two-sided likelihood ratio test (LRT) was used to calculate P-values. No adjustments were made for multiple comparisons. For visualization purposes, the y-axis for logistic regression is represented in reverse order. LCI, lower confidence interval. Sequence ontology variant consequence (“Consequence”) is represented with different symbols.
Fig. 4
Fig. 4. Case-control likelihood ratio evidence per sequence ontology variant consequence compared to ClinVar clinical classification.
Sankey plots for a BRCA1 and b BRCA2. The variants assigned case-control likelihood ratio (LR) evidence in favor of or against pathogenicity (with suggested supporting, moderate, strong, or very strong evidence strength) are simplistically annotated as “Pathogenic”, “Benign”, “Suggested case-control LR (ccLR) ACMG/AMP Evidence”, respectively. Variants with LRs between 0.48 and 2.08 are defined as “No evidence” in the “Suggested ccLR ACMG/AMP Evidence” panel. The clinical classification status (“ClinVar Class”) of variants was retrieved from the ClinVar database (last accessed on January 7, 2024).
Fig. 5
Fig. 5. Distribution of the case-control likelihood ratios for BRCA1 and BRCA2.
Histograms showing the distribution of case-control likelihood ratios (LRs) categorized by a sequence ontology variant consequence for BRCA1, b ClinVar classification for BRCA1, c sequence ontology variant consequence for BRCA2, d ClinVar classification for BRCA2. Histograms categorized by ClinVar classification are divided into two panels; the top panel represents variants curated in ClinVar as (likely) benign or (likely) pathogenic, while the bottom panel represents unclassified variants (variants not reported in ClinVar or listed in ClinVar as variants of uncertain significance or with conflicting classifications of pathogenicity). For visualization purposes the x axis represents log10(LR) values. Dashed lines represent LRs between 0.48 and 2.08 considered as of “No evidence”.
Fig. 6
Fig. 6. Overview of the case-control likelihood ratio evidence assigned per exon and sequence ontology variant consequence for BRCA1 and BRCA2.
Stacked bar plots of the suggested case-control likelihood ratio (LR) ACMG/AMP evidence per exon and sequence ontology variant consequence for a BRCA1 and b BRCA2. Exons are sequentially numbered to match the MANE Select transcripts. Although BRCA1 was initially described with 24 exons (GenBank Accession ID U14680.1), exon 4 is missing following further assessment of the gene; legacy exon numbering for BRCA1 is represented in brackets. Variants assigned case-control LR evidence in favor of or against pathogenicity (with suggested supporting, moderate, strong or very strong evidence strength) are simplistically annotated as “Pathogenic”, and “Benign” in the key, respectively. Variants with LRs between 0.48 and 2.08 are defined as “No evidence”.
Fig. 7
Fig. 7. Concordance between the case-control likelihood ratio method and functional predictors.
Concordance is shown separately for a BRCA1 and b BRCA2. The top panels for each gene represent case-control likelihood ratios (LRs) compared to variants predicted as benign (“BP4 criterion”, “predicted benign” or “functional”) or pathogenic (“PP3 criterion”, “predicted pathogenic” or “loss-of-function”) by in silico prediction methods (AlphaMissense, BayesDel, MutPred2, VEST4 and REVEL) or through high-throughput functional assays (Findlay et al., 2018, Huang et al., 2025, Sahu et al., 2025, Hu et al., 2024, Mesman et al., 2019). Yellow and green colors represent variants predicted as pathogenic or benign by functional predictors, respectively. For visualization purposes the x axis represents log10(LR) values. Box plots with individual data points display the median value, with whiskers extending to a maximum of 1.5 × interquartile range (IQR) beyond the box. The notch in the box approximates the 95% confidence interval (CI) for the median. Bottom panels for each gene represent sequence-pathogenicity heatmaps demonstrating the concordance between the case-control LR (ccLR) method and functional predictors. For the case-control LR (ccLR) evidence, red color gradient represents LR reaching suggested ACMG/AMP evidence in favor of pathogenicity with strength levels ranging from very strong (dark red) to supporting (yellow). The green color gradient represents LR reaching suggested ACMG/AMP evidence against pathogenicity with strength levels ranging from very strong (dark green) to supporting (light green). Variants with ccLR of “No evidence” are not plotted. For the functional predictors, yellow and green colors represent evidence in favor and against pathogenicity, respectively (expressed as “pathogenic supporting”). The total number of variants included in the concordance analyses is depicted in Supplementary Data 6.
Fig. 8
Fig. 8. Flowchart summarizing the study design.
Using sequencing data of 96,691 female breast cancer cases and 302,116 unaffected controls from the Breast Cancer Association Consortium (BCAC), the Cancer Risk Estimates Related to Susceptibility (CARRIERS) consortium and the UK Biobank (UKB) we calculated case-control likelihood ratios (LRs) and odds ratios (ORs) for 11,207 BRCA1 and BRCA2 variants, of which 6909 are coding (coding sequence, CDS ± 5 bp). Derived LRs and ORs were further aligned to ACMG/AMP evidence strengths to provide evidence in favor of or against pathogenicity following sensitivity analyses-derived variant exclusion criteria.

Update of

  • Analysis of more than 400,000 women provides case-control evidence for BRCA1 and BRCA2 variant classification.
    Zanti M, O'Mahony DG, Parsons MT, Dorling L, Dennis J, Boddicker NJ, Chen W, Hu C, Naven M, Yiangou K, Ahearn TU, Ambrosone CB, Andrulis IL, Antoniou AC, Auer PL, Baynes C, Bodelon C, Bogdanova NV, Bojesen SE, Bolla MK, Brantley KD, Camp NJ, Campbell A, Castelao JE, Cessna MH, Chang-Claude J, Chen F, Chenevix-Trench G; NBCS Collaborators; Conroy DM, Czene K, De Nicolo A, Domchek SM, Dörk T, Dunning AM, Eliassen AH, Evans DG, Fasching PA, Figueroa JD, Flyger H, Gago-Dominguez M, García-Closas M, Glendon G, González-Neira A, Grassmann F, Hadjisavvas A, Haiman CA, Hamann U, Hart SN, Hartman MBA, Ho WK, Hodge JM, Hoppe R, Howell SJ; kConFab Investigators; Jakubowska A, Khusnutdinova EK, Ko YD, Kraft P, Kristensen VN, Lacey JV, Li J, Lim GH, Lindström S, Lophatananon A, Luccarini C, Mannermaa A, Martinez ME, Mavroudis D, Milne RL, Muir K, Nathanson KL, Nuñez-Torres R, Obi N, Olson JE, Palmer JR, Panayiotidis MI, Patel AV, Pharoah PDP, Polley EC, Rashid MU, Ruddy KJ, Saloustros E, Sawyer EJ, Schmidt MK, Southey MC, Tan VK, Teo SH, Teras LR, Torres D, Trentham-Dietz A, Truong T, Vachon CM, Wang Q, Weitzel JN, Yadav S, Yao S, Zirpoli GR, Cline MS, Devilee P, Tavtigian SV, Goldgar DE, Couc… See abstract for full author list ➔ Zanti M, et al. medRxiv [Preprint]. 2024 Sep 4:2024.09.04.24313051. doi: 10.1101/2024.09.04.24313051. medRxiv. 2024. Update in: Nat Commun. 2025 May 25;16(1):4852. doi: 10.1038/s41467-025-59979-6. PMID: 39281752 Free PMC article. Updated. Preprint.

References

    1. Federici, G. & Soddu, S. Variants of uncertain significance in the era of high-throughput genome sequencing: a lesson from breast and ovary cancers. J. Exp. Clin. Cancer Res39, 46 (2020). - PMC - PubMed
    1. Parsons, M. T. et al. Evidence-based recommendations for gene-specific ACMG/AMP variant classification from the ClinGen ENIGMA BRCA1 and BRCA2 Variant Curation Expert Panel. Am. J. Hum. Genet.111, 2044–2058 (2024). - PMC - PubMed
    1. Hu, C. et al. A population-based study of genes previously implicated in breast cancer. N. Engl. J. Med384, 440–451 (2021). - PMC - PubMed
    1. Dorling, L. et al. Breast cancer risk genes - association analysis in more than 113,000 women. N. Engl. J. Med384, 428–439 (2021). - PMC - PubMed
    1. Antoniou, A. et al. Average risks of breast and ovarian cancer associated with BRCA1 or BRCA2 mutations detected in case Series unselected for family history: a combined analysis of 22 studies. Am. J. Hum. Genet72, 1117–1130 (2003). - PMC - PubMed

Grants and funding