. 2025 May 24;8(1):305.
doi: 10.1038/s41746-025-01723-x.

Enhanced staging of renal cell carcinoma using tumor morphology features: model development and multi-source validation

Affiliations

Enhanced staging of renal cell carcinoma using tumor morphology features: model development and multi-source validation

Enyu Yuan et al. NPJ Digit Med. .

Abstract

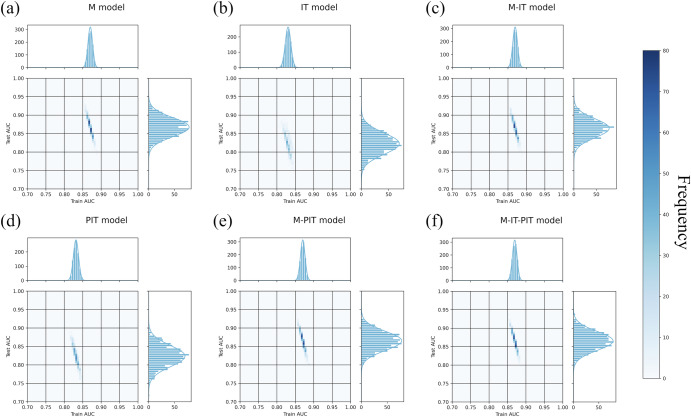
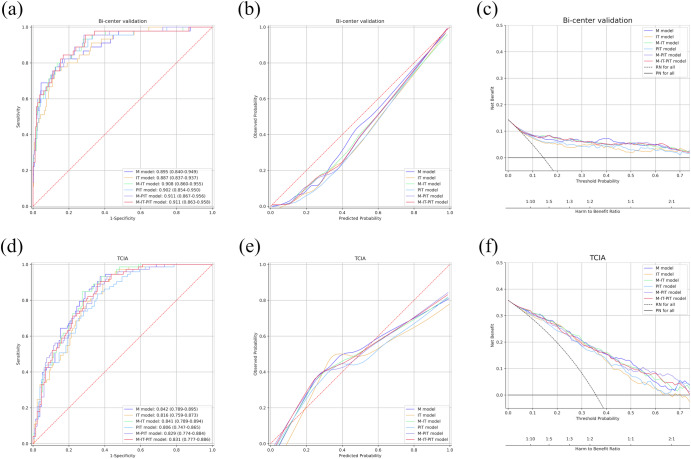
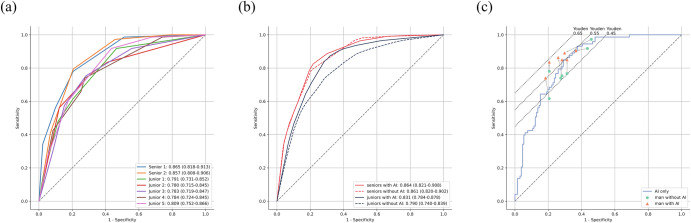
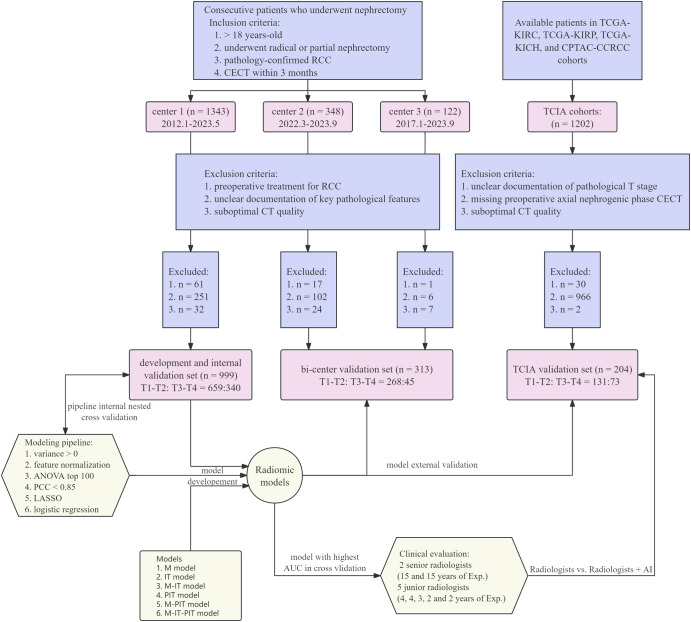
Preoperative detection of pT3a invasion in non-metastatic renal cell carcinoma (RCC) remains challenging with CT. This study developed and validated radiomic models using preoperative CT to identify pT3a invasions. Six models were trained and internally validated via nested cross-validation on 999 patients from one hospital. External validation included 313 patients from two hospitals and 204 patients from four TCIA datasets. A multi-reader multi-case study with seven radiologists evaluated the model's incremental value. The morphology model achieved the highest internal AUC (0.867, 95% CI: 0.866-0.869) and maintained performance in external validations (AUC = 0.895 and 0.842). When used as a second reader, it significantly improved junior radiologists' sensitivity and discrimination (AUC: 0.790 vs. 0.831, p < 0.001) without compromising specificity. This study demonstrates that CT-based radiomic models, particularly the morphology model, can reliably detect pT3a invasion and enhance diagnostic accuracy for junior radiologists, offering potential clinical utility in preoperative staging.


Conflict of interest statement

Competing interests: The authors declare no competing interests.

Figures

Fig. 1
Fig. 1. Feature importance of the radiomic models.
The purple bar denotes the median feature coefficient along with lower and upper quartiles in the logistic regression model in 1000 outer loops. The green line denotes the frequency of being selected as the final feature in 1000 outer loops. The pink bar denotes the feature coefficient in the final model. a Morphology model, b tumor intensity and texture model, c morphology and tumor intensity and texture model, d peritumor intensity and texture model, e morphology and peritumor intensity and texture model, f morphology, tumor and peritumor intensity and texture model.
Fig. 2
Fig. 2. The joint distribution of area under receiver operating characteristic curve of cross validation training and test sets in 1000 outer loops.
a Morphology model, b tumor intensity and texture model, c morphology and tumor intensity and texture model, d peritumor intensity and texture model, e morphology and peritumor intensity and texture model, f morphology, tumor and peritumor intensity and texture model.
Fig. 3
Fig. 3. The discrimination, calibration, and clinical utility of the developed models in two external validation datasets.
a The receiver operating characteristic (ROC) curves in bi-center validation dataset, b the calibration curves in bi-center validation dataset, c the decision curves in bi-center validation dataset, d the receiver operating characteristic (ROC) curves in The Cancer Imaging Archive (TCIA) validation dataset, e the calibration curves in TCIA dataset, and f the decision curves in TCIA dataset.
Fig. 4
Fig. 4. Key results of clinical evaluation.
a The receiver operating characteristic (ROC) curves of individual radiologists, b the average ROC curves for senior and junior radiologists, and c using a cutoff score of 2, the change in sensitivity and specificity of each radiologists were depicted. AI artificial intelligence.
Fig. 5
Fig. 5. Flowchart of patient selection at the three institutions and four public datasets.
RCC renal cell carcinoma, CECT contrast-enhanced computed tomography, TCIA The Cancer Imaging Archive, ANOVA analysis of variance, PCC Pearson correlation coefficient, LASSO Least absolute shrinkage and selection operator, M morphology, IT intensity and texture, PIT peritumor intensity and texture, Exp experience, AI artificial intelligence.

References

    1. Capitanio, U. et al. Epidemiology of renal cell carcinoma. Eur. Urol.75, 74–84 (2019). - PMC - PubMed
    1. Ljungberg, B. et al. European Association of Urology Guidelines on renal cell carcinoma: the 2022 update. Eur. Urol.82, 399–410 (2022). - PubMed
    1. Johnson, C. D., Dunnick, N. R., Cohan, R. H. & Illescas, F. F. Renal adenocarcinoma: CT staging of 100 tumors. Am. J. Roentgenol.148, 59–63 (1987). - PubMed
    1. Türkvatan, A. et al. Preoperative staging of renal cell carcinoma with multidetector CT. Diagn. Interv. Radiol.15, 22–30 (2009). - PubMed
    1. Liu, Y., Song, T., Huang, Z., Zhang, S. & Li, Y. The accuracy of multidetector computed tomography for preoperative staging of renal cell carcinoma. Int. Braz. J. Urol.38, 627–636 (2012). - PubMed

LinkOut - more resources