. 2025 May 24;26(1):134.
doi: 10.1186/s12859-025-06128-x.

Gene2role: a role-based gene embedding method for comparative analysis of signed gene regulatory networks

Affiliations

Gene2role: a role-based gene embedding method for comparative analysis of signed gene regulatory networks

Xin Zeng et al. BMC Bioinformatics. .

Abstract

Background: Understanding the dynamics of gene regulatory networks (GRNs) across various cellular states is crucial for deciphering the underlying mechanisms governing cell behavior and functionality. However, current comparative analytical methods, which often focus on simple topological information such as the degree of genes, are limited in their ability to fully capture the similarities and differences among the complex GRNs.

Results: We present Gene2role, a gene embedding approach that leverages multi-hop topological information from genes within signed GRNs. Initially, we demonstrated the effectiveness of Gene2role in capturing the intricate topological nuances of genes using GRNs inferred from four distinct data sources. Then, applying Gene2role to integrated GRNs allowed us to identify genes with significant topological changes across cell types or states, offering a fresh perspective beyond traditional differential gene expression analyses. Additionally, we quantified the stability of gene modules between two cellular states by measuring the changes in the gene embeddings within these modules.

Conclusions: Our method augments the existing toolkit for probing the dynamic regulatory landscape, thereby opening new avenues for understanding gene behavior and interaction patterns across cellular transitions.

Keywords: Gene module analysis; Gene regulatory network analysis; Graph representation learning.


Conflict of interest statement

Declarations. Ethics approval and consent to participate: Not applicable. Consent for publication: Not applicable. Competing interests: The authors declare no competing interests.

Figures

Fig. 1
Fig. 1
Overview of the Gene2role framework. Gene2role is a multi-scale analysis framework for GRNs using a role-based graph embedding approach, which includes three components: network construction (left), embedding generation (middle), and downstream analysis (right). In network construction, one or more GRNs inferred by various methods are built, such as single-cell co-expression networks and single-cell multi-omics networks. In embedding generation, first, each gene is mapped to a 2-dimensional vector degree representing the number of positive and negative links. Next, the similarity between genes is evaluated using a series of distance functions that integrate multi-hop local topology information around the genes. Finally, the embedding is learned using the struc2vec framework. In downstream analysis, gene-level and gene-module-level analyses are performed. In gene-level analysis, differentially topological genes (such as G2) are extracted by comparing the distances of embeddings between GRNs. In gene-module-level analysis, the stability analysis of gene modules is performed by comparing the average distance between two GRNs and the proportion of genes that exist only in one of the GRNs (NA%) for pre-extracted gene modules. GRN, Gene regulatory network
Fig. 2
Fig. 2
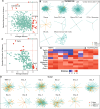
Analysis of GRN embeddings from networks derived through various methods. A, C Simulated tree GRN (A) and HSC network (C). B, D 2D embeddings for networks from A and C, respectively. The embeddings were generated by Gene2role, struc2vec, and BESIDE, respectively. E, G K-means (K = 10) clustering of embeddings from B cells in human PBMC dataset (E) and Ery_0 stage in multi-omics dataset (G) displayed in UMAP. F, H Heatmap displaying the average values of 8 network feature metrics for the 10 clusters of genes from E and G within the GRN. The color scaling within each row is determined by the maximum and minimum values of that row. UMAP, Uniform manifold approximation and projection
Fig. 3
Fig. 3
Distinctive analysis of DTGs in comparison with DEGs across two cell types. A histogram of the frequency distribution of Gene2role embedding pair distances in GRNs at 0-h and 12-h stage within a human glioblastoma dataset, with the top 10th percentile of average distances designated as DTGs. B, E, and H Venn diagrams depict the intersection between DEGs and DTGs identified in human glioblastoma at 0-h and 12-h stage (B), in human PBMCs comparing naïve CD4 T cells with mature CD4 T cells (E), and in human BMMC comparing GMPs with CD14 + Monocytes (H), respectively. C, F, and I Examples of genes that are exclusively DTGs not overlapping with DEGs from the intersecting sets in B, E, and H, respectively. D, G, J 1-hop network structures corresponding to the DTG shown in C, F, and I. DTGs, differentially topological genes; DEGs, differentially expressed genes; PBMC, peripheral blood mononuclear cells; BMMC, human bone marrow mononuclear cells; GMPs, granulocyte-macrophage progenitors
Fig. 4
Fig. 4
Comparative analysis of gene distance across multiple cell types. A Scatter plot of the average and standard deviation of gene distances within human PBMC dataset across 10 cell types, with genes in the top 5th percentile of average distances or standard deviation greater than 0.4 were categorized as DTGs. B 1-hop network structures of TNFRSF13B in ten GRNs from human PBMC datase. C Scatter plot of the average and standard deviations of gene distances between each pair of adjacent cell types in the differentiation trajectory of MEPs. D Heatmap of two patterns of gene role changes during MEP differentiation: the top heatmap represents genes with high variance and low average distance, while the bottom heatmap depicts genes with low variance but high average distance. E 1-hop network structures of TNFRSF13B in eleven GRNs from multi-omics dataset. MEPs, Megakaryocyte-erythroid progenitors
Fig. 5
Fig. 5
Gene module stability analysis using Gene2role embeddings. A Scatter plot depicting the mean distance and the percentage of genes exclusively found in the anchor cell type (NA%) for seven gene modules in a human glioblastoma dataset, using the 0-h stage as the anchor cell type and comparing against the 12-h stage. B Dot plot of the top 5 significant biological processes from the GO analysis for gene modules 0 and 5 in A. C Scatter plot for twelve gene modules during MEP differentiation, with the Ery_0 stage as the anchor cell type and comparing against the Ery_9 stage, illustrating the mean distance and percent of genes unique to the anchor cell type (NA%). D Dot plot for the top 5 significant biological processes from the GO analysis of gene modules 7 and 9 in C

Similar articles

References

    1. Emmert-Streib F, Dehmer M, Haibe-Kains B. Gene regulatory networks and their applications: understanding biological and medical problems in terms of networks. Front Cell Dev Biol. 2014. 10.3389/fcell.2014.00038/abstract. - PMC - PubMed
    1. Akers K, Murali TM. Gene regulatory network inference in single-cell biology. Curr Opin Syst Biol. 2021;26:87–97.
    1. Nakajima N, Hayashi T, Fujiki K, Shirahige K, Akiyama T, Akutsu T, et al. Codependency and mutual exclusivity for gene community detection from sparse single-cell transcriptome data. Nucl Acids Res. 2021;49(18):e104–e104. - PMC - PubMed
    1. Badia-i-Mompel P, Wessels L, Müller-Dott S, Trimbour R, Ramirez Flores RO, Argelaguet R, et al. Gene regulatory network inference in the era of single-cell multi-omics. Nat Rev Genet. 2023;24(11):739–54. - PubMed
    1. Kamimoto K, Stringa B, Hoffmann CM, Jindal K, Solnica-Krezel L, Morris SA. Dissecting cell identity via network inference and in silico gene perturbation. Nature. 2023;614(7949):742–51. - PMC - PubMed

LinkOut - more resources