

Assessing the impact of building footprint dataset choice for health programme planning: a case study of indoor residual spraying (IRS) in Zambia
- PMID: 40413449
- PMCID: PMC12103797
- DOI: 10.1186/s12942-025-00398-7
Assessing the impact of building footprint dataset choice for health programme planning: a case study of indoor residual spraying (IRS) in Zambia
Abstract
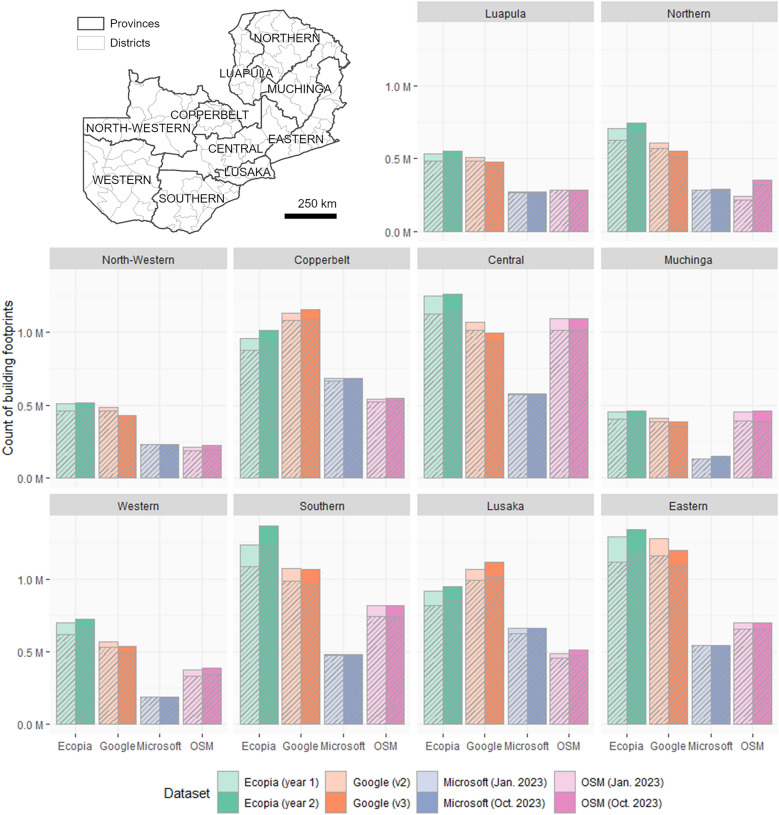
Background: The increasing availability globally of building footprint datasets has brought new opportunities to support a geographic approach to health programme planning. This is particularly acute in settings with high disease burdens but limited geospatial data available to support targeted planning. The comparability of building footprint datasets has recently started to be explored, but the impact of utilising a particular dataset in analyses to support decision making for health programme planning has not been studied. In this study, we quantify the impact of utilising four different building footprint datasets in analyses to support health programme planning, with an example of malaria vector control initiatives in Zambia.
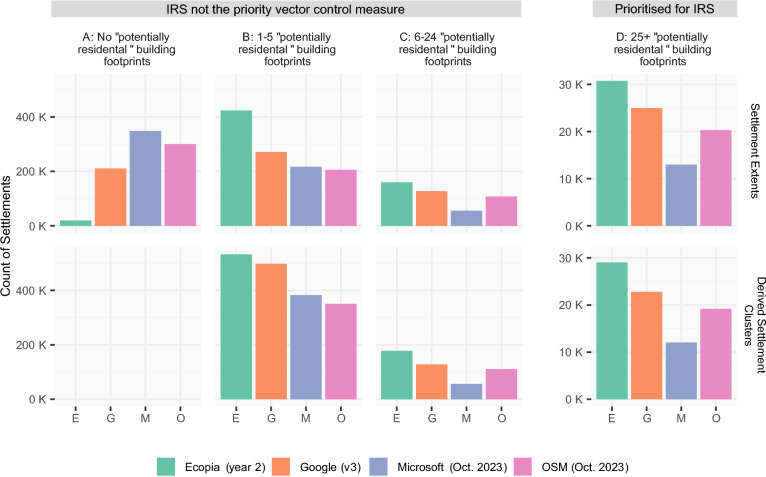
Methods: Using the example of planning indoor residual spraying (IRS) campaigns in Zambia, we identify priority locations for deployment of this intervention based on criteria related to the area, proximity and counts of building footprints per settlement. We apply the same criteria to four different building footprint datasets and quantify the count and geographic variability in the priority settlements that are identified.
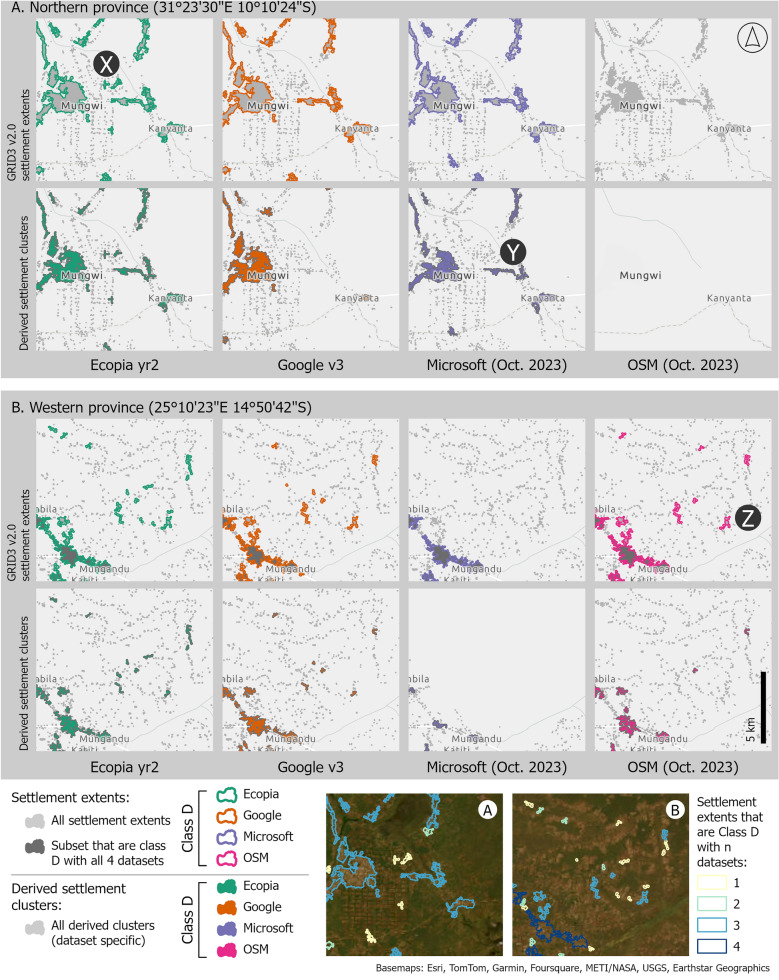
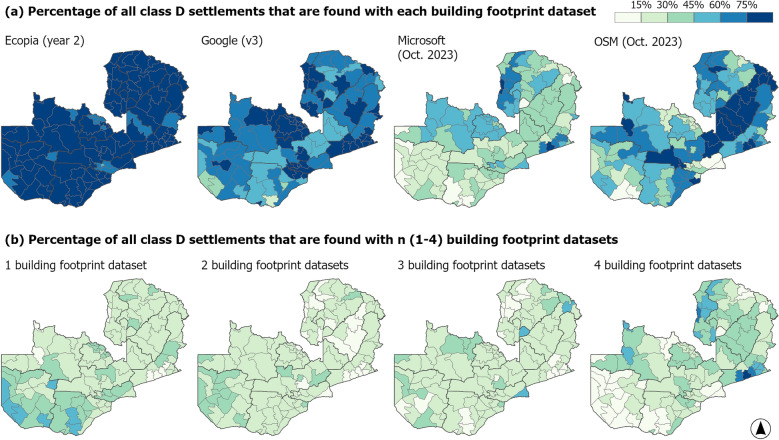
Results: We show that nationally the count of potential priority settlements for IRS varies by over 230% with different building footprint datasets, considering a minimum threshold of 25 sprayable buildings per settlement. Differences are most pronounced for rural settlements, indicating that the choice of dataset may bias the selection to include or exclude settlements, and consequently population groups, in some areas.
Conclusions: The results of this study show that the choice of building footprint dataset can have a considerable impact on the potential settlements identified for IRS, in terms of (i) their location and count, and (ii) the count of building footprints within priority settlements. The choice of dataset potentially has substantial implications for campaign planning, implementation and coverage assessment. Given the magnitude of the differences observed, further work should more broadly assess the sensitivity of health programme planning metrics to different building footprint datasets, and across a range of geographic contexts and health campaign types.
Keywords: Building footprints; Geospatial; Malaria; Microplanning; Satellite imagery.
© 2025. The Author(s).
Conflict of interest statement
Declarations. Ethics approval and consent to participate: Not applicable. Consent for publication: Not applicable. Competing interests: The authors declare that they have no competing interests.
Figures


References
-
- Ali D, Levin A, Abdulkarim M, Tijjani U, Ahmed B, Namalam F, Dougherty L. A cost-effectiveness analysis of traditional and geographic information system-supported microplanning approaches for routine immunization program management in northern Nigeria. Vaccine. 2020;38(6):1408–15. 10.1016/j.vaccine.2019.12.002. - DOI - PubMed
-
- WHO. Guidance on developing a national deployment and vaccination plan for COVID-19 vaccines: interim guidance, 1 June 2021. Geneva: World Health Organization. 2021
Publication types
MeSH terms
Substances
Grants and funding
LinkOut - more resources
Full Text Sources
Medical
