. 2025 May 24;13(1):116.
doi: 10.1186/s40478-025-02005-z.

Viral-mediated knockdown of Atxn2 attenuates TDP-43 pathology and muscle dysfunction in the PFN1C71G ALS mouse model

Affiliations

Viral-mediated knockdown of Atxn2 attenuates TDP-43 pathology and muscle dysfunction in the PFN1C71G ALS mouse model

Zachary C E Hawley et al. Acta Neuropathol Commun. .

Abstract

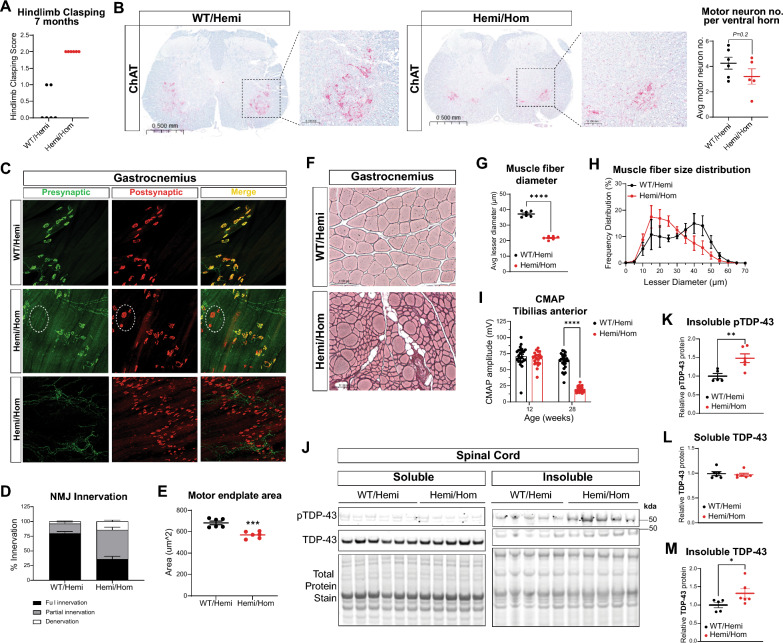
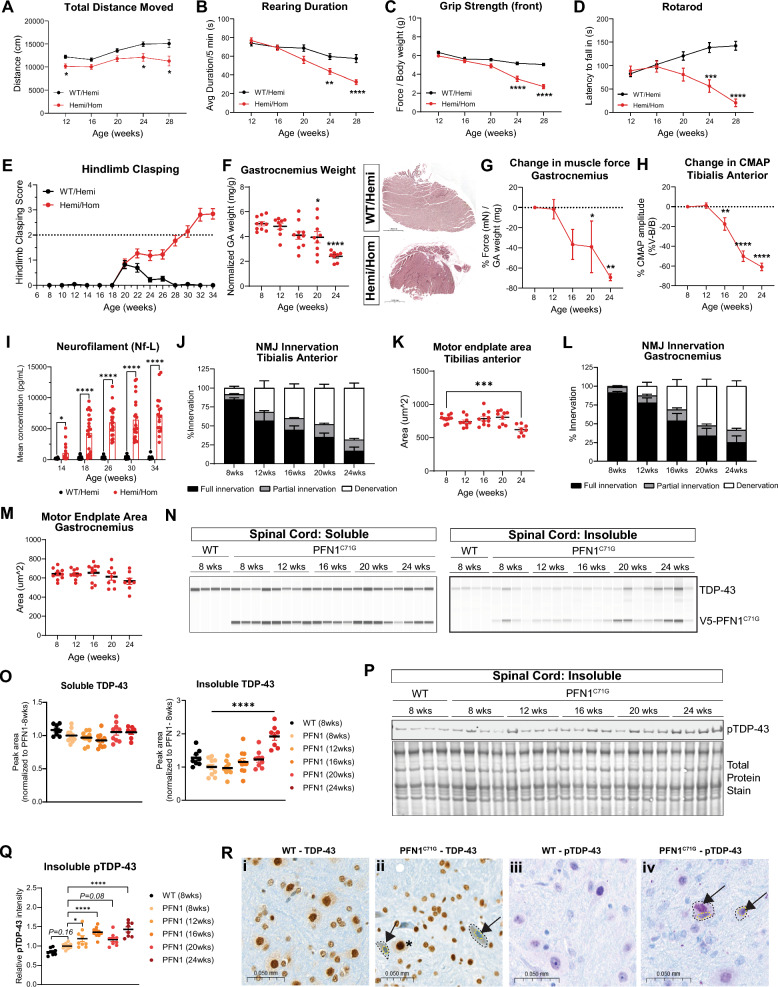
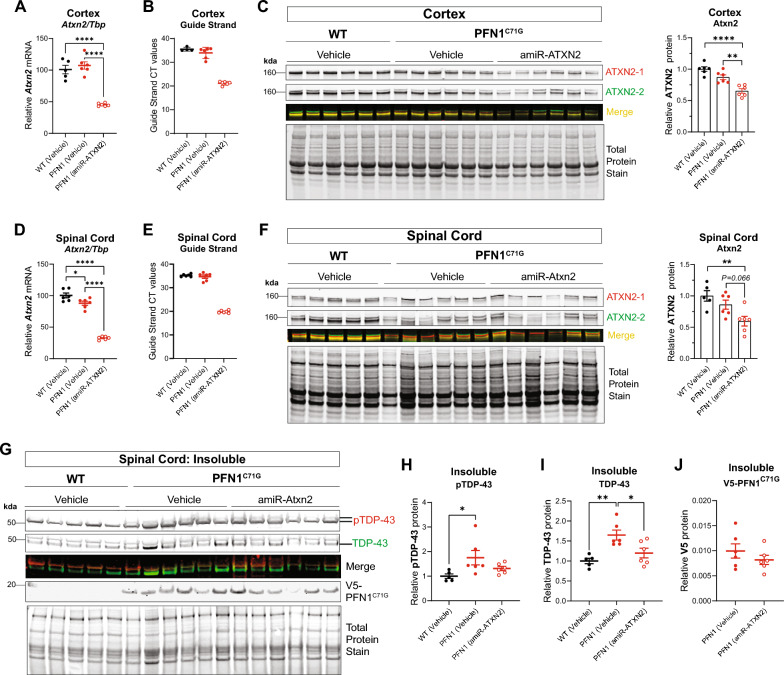
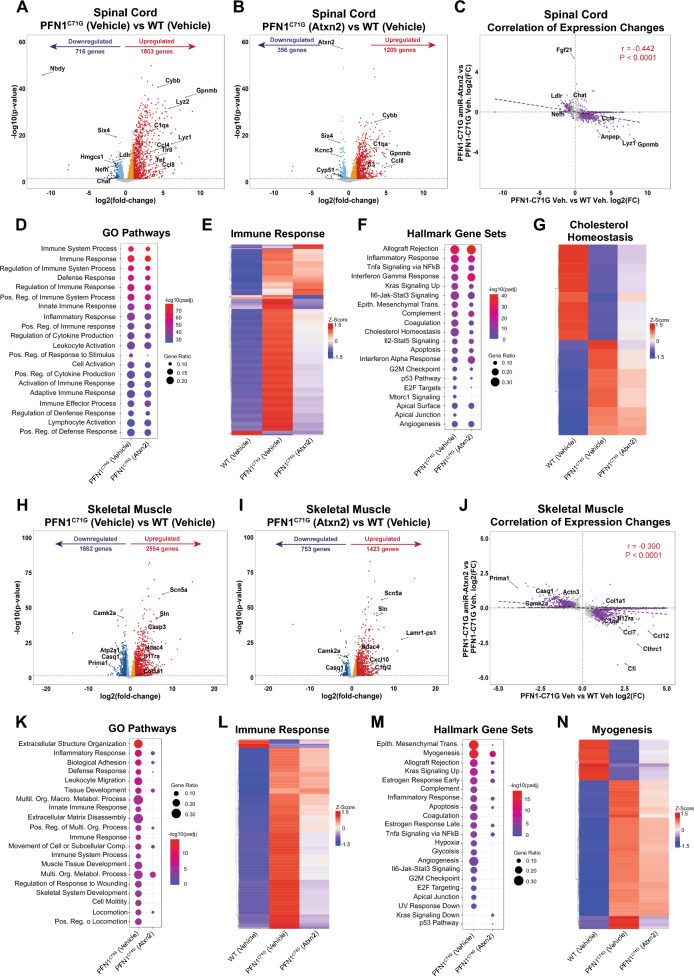
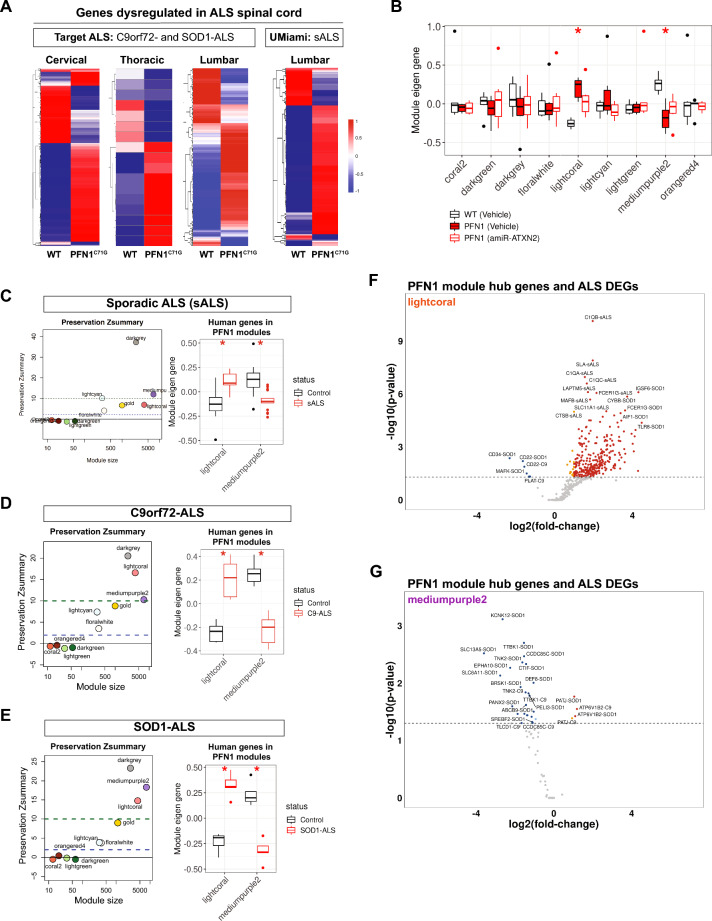
Amyotrophic lateral sclerosis (ALS) is a fatal neurodegenerative disorder characterized by progressive motor neuron loss and muscle atrophy. Hyperphosphorylated aggregation of the RNA-binding protein, TDP-43, in the motor cortex and spinal cord are defining molecular features of ALS, suggesting TDP-43 dysfunction underlies disease pathogenesis. This phenomenon, however, has been difficult to recapitulate endogenously in animal models, impeding characterization of TDP-43 pathobiology in neurodegeneration. In this study, we report age-dependent accumulation of TDP-43 pathology in the spinal cord and progressive muscle-related deficits in transgenic mice expressing the ALS-associated PFN1C71G mutant protein. We show that transgenic neuronal expression of PFN1C71G induces early hyperphosphorylation of endogenous TDP-43 in the spinal cord that augments over time, preceding accumulation of insoluble non-phosphorylated TDP-43 and the manifestation of muscle denervation and motor dysfunction. Sustained knockdown of Atxn2 in the central nervous system (CNS) in pre-symptomatic PFN1C71G mice by AAV-driven expression of an artificial microRNA (AAV-amiR-Atxn2) reduces aberrant TDP-43 in the spinal cord, while delaying neurodegeneration and improving muscle and motor function. RNA-sequencing analysis of spinal cord samples from PFN1C71G mice and ALS donors show shared patterns of transcriptional perturbation, including a pro-inflammatory gene signature that is attenuated by AAV-amiR-Atxn2. Notably, impaired regulation of the PFN1C71G skeletal muscle transcriptome exceeds that of the spinal cord and is also improved by Atxn2 reduction in the CNS. Lastly, we find significant gene co-expression network homology between PFN1C71G mice and human ALS, with shared dysregulation of modules related to neuroinflammation and neuronal function and uncover novel hub genes that provide biological insight into ALS and potential drug targets that can be further investigated in this mouse model.


Conflict of interest statement

Declarations. Ethical approval and consent to participate: All procedures were formed in accordance with NIH Guide for the Care and Use of Experimental Animals and studies were approved by the Biogen Institutional Animal Care and Use Committee (IACUC). Consent for publication: Not applicable. Competing interests: All authors are employees of Biogen (Cambridge, MA, USA).

Figures

Fig. 1
Fig. 1
Symptomatic Hemi/Hom PFN1C71G transgenic mice show significant TDP-43 pathology and muscle denervation without commensurate loss of spinal motor neurons. A Hindlimb clasping scores in 28-week-old WT/Hemi and Hemi/Hom PFN1C71G transgenic mice. A score of 2 represents clasping of both hindlimbs. B Representative immunohistology images of ChAT + motor neurons in lumbar spinal cord sections of PFN1C71G WT/Hemi and Hemi/Hom mice (left). Quantification of motor neuron number per ventral horn (right) showing a trend towards reduced motor neuron number in Hemi/Hom (n = 6) mice (Unpaired t-test). C Representative images of NMJs in gastrocnemius muscles of WT/Hemi and Hemi/Hom mice stained with presynaptic neurofilament/SV2 (green) and post-synaptic bungarotoxin (red). White dotted ellipse encircles a cluster of denervated NMJ terminals in one Hemi/Hom animal and bottom images from another Hemi/Hom mouse show widespread muscle denervation. D Quantification of NMJ innervation status and E motor endplate area in WT/Hemi and Hemi/Hom animals (Unpaired t-test). F Representative histological images of reticulin-stained gastrocnemius muscles from WT/Hemi and Hemi/Hom animals. G Quantification of average gastrocnemius muscle fiber diameter (Unpaired t-test) and H size distribution. I CMAP amplitudes decline with age in Hemi/Hom mice (2-way ANOVA with Sidak’s multiple comparisons). J Representative western blots showing phosphorylated TDP-43 (pTDP-43), TDP-43, and total protein levels in NP-40 soluble and insoluble (urea soluble) protein fractions from WT/Hemi and Hemi/Hom spinal cord tissues. Semi-quantification of K insoluble pTDP-43 (Unpaired t-test), L soluble TDP-43 (Mann–Whitney U-test), and M insoluble TDP-43 protein (Mann–Whitney U-test). For all graphs, each point denotes an individual subject (WT/Hemi, n = 6; Hemi/Hom, n = 6). Error bars represent s.e.m. and statistical tests were two-sided unless stated otherwise. *P < 0.05; **P < 0.01; ***P < 0.001; ****P < 0.0001
Fig. 2
Fig. 2
Phosphorylation of TDP-43 in the spinal cord and motor neuron degeneration precedes muscle dysfunction and motor deficits in Hemi/Hom PFN1C71G transgenic mice. A Locomotor activity in an open field arena is reduced in Hemi/Hom (n = 22) mice relative to WT/Hemi (n = 23) controls (Mixed-effects analysis with Sidak’s multiple comparisons). B Hemi/Hom (n = 22) mice show a progressive decline in rearing behavior in an open field arena (Mixed-effects analysis with Sidak’s multiple comparisons). C Grip strength (forelimbs) and D rotarod performance decrease with age in Hemi/Hom mice (n = 22) compared to WT/Hemi (n = 23) animals (Mixed-effects analysis with Sidak’s multiple comparisons). E Progressive hindlimb clasping in Hemi/Hom mice (n = 22). Mice were scored 0 to 5 according to the following parameters: 0 = limbs splayed outward; 1 = one limb retracted toward abdomen; 2 = two limbs retracted toward abdomen; 3 = three limbs retracted toward abdomen; 4 = four limbs retracted toward abdomen; 5 = all limbs retracted toward abdomen. F Gastrocnemius muscle weight decreases over time in Hemi/Hom mice (n = 8–10 per timepoint; One-way ANOVA with Dunnett’s multiple comparisons) and H&E of muscle fiber changes in the gastrocnemius muscle. Progressive decline in G gastrocnemius muscle force (Kruskal–Wallis test with Dunn’s multiple comparisons) and H CMAP amplitudes in Hemi/Hom mice (n = 8–10 per timepoint; Mixed-effects analysis with Dunnett’s multiple comparisons). I Plasma neurofilament-light chain (Nf-L) levels in Hemi/Hom mice (n = 22) increase with age. J NMJ innervation declines before K terminal area reduction in tibialis anterior muscle of Hemi/Hom mice (n = 8–10 per timepoint). L NMJ innervation in the gastrocnemius muscle but not M terminal area declines in Hemi/Hom mice (n = 8–46 per timepoint). N Representative image of a capillary-based western of TDP-43 and V5-tagged PFN1C71G protein in NP-40 soluble and NP-40 insoluble (urea soluble) protein fractions from Hemi/Hom mice of varying ages and 8-week-old strain-matched FVB/NJ WT controls. O Quantification of soluble and insoluble TDP-43 at different timepoints compared to WT controls (One-way ANOVA with Dunnett’s multiple comparisons). P Representative western blot of phosphorylated TDP-43 protein in NP-40 insoluble (urea soluble) protein fraction from Hemi/Hom mice of varying ages and strain-matched 8-week-old FVB/NJ WT controls. Q Quantification of insoluble phosphorylated TDP-43 at different timepoints compared to WT controls (One-way ANOVA with Dunnett’s multiple comparisons). R Immunohistochemistry of either TDP-43 (brown; i & ii) or phosphorylated TDP-43 (purple—serine 409/410; iii & iv) in mouse lumbar spinal cord from 32–35 week-old mice. WT controls showed expected TDP-43 and phosphorylated TDP-43 staining (i & iii). PFN1C71G mice contain neurons with loss of nuclear TDP-43 and positive staining for TDP-43 in the cytoplasm (ii; black arrows). PFN1C71G showed evidence of neuronal nuclear and cytoplasmic aggregates of phosphorylated pTDP-43 (iv; black arrows). Black and yellow outlines represent cell bodies and nuclei, respectively. *P < 0.05; **P < 0.01; ***P < 0.001; ****P < 0.0001. Error bars represent s.e.m. and statistical tests were two-sided unless stated otherwise
Fig. 3
Fig. 3
Reduction of Atxn2 in PFN1C71G animals by AAV-amiR-Atxn2 treatment reduces TDP-43 pathology in the spinal cord. A Tbp-normalized Atxn2 mRNA levels in neocortical tissues isolated from 34 to 36-week-old vehicle- and amiR-Atxn2-treated PFN1C71G mice relative to vehicle-treated WT mice (One-way ANOVA with Tukey’s multiple comparisons). B RT-qPCR cycle threshold (CT) values of the amiR-Atxn2 guide strand obtained in the cortex of vehicle-treated WT mice and vehicle- and amiR-Atxn2-treated PFN1C71G mice. C Representative western blot image of cortical Atxn2 protein levels detected by two different ATXN2 antibodies recognizing mouse Atxn2. Semi-quantification of the single co-localized band (yellow) is shown on the right (One-way ANOVA with Tukey’s multiple comparisons). D Tbp-normalized Atxn2 mRNA levels in spinal cord tissues isolated from 34 to 36-week-old vehicle- and amiR-Atxn2-treated PFN1C71G mice relative to vehicle-treated WT mice (One-way ANOVA with Tukey’s multiple comparisons). E RT-qPCR cycle threshold (CT) values of the amiR-Atxn2 guide strand obtained in the spinal cord of vehicle-treated WT mice and vehicle- and amiR-Atxn2-treated PFN1C71G mice. F Representative western blot image of spinal cord Atxn2 protein levels detected by two different ATXN2 antibodies recognizing mouse Atxn2. Semi-quantification of the single co-localized band (yellow) is shown on the right (One-way ANOVA with Tukey’s multiple comparisons). G Representative western blot image showing insoluble pTDP-43 at S409/410 (ticks demarcate two separate pTDP-43-positive bands in PFN1C71G samples), TDP-43, and V5-tagged PFN1C71G protein in age-matched WT and PFN1C71G spinal cord lysates. H Semi-quantification of pTDP-43, I non-phosphorylated TDP-43, and J PFN1C71G protein levels from western blot in (G) shows rescue of insoluble accumulation of pTDP-43 and TDP-43 but not PFN1C71G in AAV-amiR-ATXN2-treated animals relative to controls. For all graphs, each point denotes an individual subject (WT-vehicle, n = 5–6; PFN1C71G-vehicle, n = 6; PFN1C71G-AAV-amiR-Atxn2, n = 5–6). Error bars represent s.e.m. and statistical tests were two-sided unless stated otherwise. *P < 0.05; **P < 0.01; ***P < 0.001; ****P < 0.0001
Fig. 4
Fig. 4
AAV-amiR-Atxn2 treatment reduces blood neurofilament levels and improves muscle and motor function in PFN1C71G transgenic mice. A Age-dependent rise in plasma Nf-L levels in PFN1C71G mice is attenuated by AAV-amiR-Atxn2 treatment (WT-vehicle, n = 20; PFN1C71G-vehicle, n = 20; PFN1C71G-AAV-amiR-Atxn2, n = 21; Mixed-effects analysis with Tukey’s multiple comparisons). B Body weight loss in PFN1C71G mice is rescued by AAV-amiR-Atxn2 treatment. C Grip strength declines more gradually in PFN1C71G mice treated with AAV-amiR-Atxn2. D Hindlimb clasping is partially rescued by AAV-amiR-Atxn2 in PFN1C71G mice. E Progressive decline in locomotor activity in an open field arena is rescued by AAV-amiR-Atxn2 treatment in PFN1C71G mice. F AAV-amiR-Atxn2 in PFN1C71G mice produces a more gradual decline in vertical rearing behavior in an open field arena. G Rotarod performance in PFN1C71G mice is significantly rescued by AAV-driven expression of an Atxn2-targeting amiR. For all motor behavior graphs, WT (vehicle), n = 17; PFN1C71G (vehicle), n = 15; PFN1C71G (AAV-amiR-Atxn2), n = 18 (One-way ANOVA with Tukey’s multiple comparisons test). H Decline in gastrocnemius muscle force is significantly improved in PFN1C71G mice given AAV-amiR-Atxn2. WT (vehicle), n = 15; PFN1C71G (vehicle), n = 15; PFN1C71G (AAV-amiR-Atxn2), n = 15 (Mixed-effects analysis with Tukey’s multiple comparisons test). I Representative histological images from gastrocnemius muscles isolated from vehicle-treated WT and PFN1C71G mice, and AAV-amiR-Atxn2-treated PFN1C71G mice. J Muscle fiber lesser diameter is significantly increased in AAV-amiR-Atxn2-treated PFN1C71G mice relative to vehicle-treated PFN1C71G mice (One-way ANOVA with Tukey’s multiple comparisons). K Histogram charting frequency distribution of muscle fiber lesser diameters in vehicle-treated WT (n = 5) and PFN1C71G mice (n = 6), and AAV-amiR-Atxn2-treated PFN1.C71G mice (n = 6). Error bars represent s.e.m. and statistical tests were two-sided unless stated otherwise. *P < 0.05; **P < 0.01; ***P < 0.001; ****P < 0.0001
Fig. 5
Fig. 5
AAV-amiR-Atxn2 treatment attenuates immune-based responses in both spinal cord and muscle tissues of PFN1C71G mice. RNA-sequencing analysis of either spinal cord (A-G) or skeletal muscle tissue (H-N). AB Volcano plots showing changes in gene expression in spinal cord of PFN1C71G mice treated with either vehicle (A) or AAV-amiR-Atxn2 (B) compared to wild-type animals treated with vehicle (n = 6). Red and dark blue dots represent upregulated and downregulated genes, respectively, with > twofold change and padj < 0.05. Orange and light blue dots represent significantly upregulated and downregulated genes, respectively, with < twofold change and padj < 0.05. C Correlation of gene expression changes when PFN1C71G vehicle treated animals are compared to wild-type vehicle treated or PFN1C71G AAV-amiR-Atxn2 treated mice. Pearson correlation coefficient (r) was used to determine the linear correlation between the two conditions. Purple dots represent genes that were significantly changed (padj < 0.05) in either condition. Grey dots represent genes that had a padj > 0.05 in both conditions. D Bubble plot of the top 20 gene ontology (GO) terms based on dysregulated genes that have a ≥ twofold change and padj < 0.05 in the spinal cord of PFN1C71G mice. E Heatmap of gene expression changes in GO immune response across groups. F Enriched hallmark gene sets based on dysregulated genes that have a ≥ twofold change and padj < 0.05 in the spinal cord of PFN1C71G mice. G Heatmap of gene expression changes in the cholesterol homeostasis hallmark gene set across groups. HI Volcano plots showing changes in genes expression in the skeletal muscle of PFN1C71G mice when treated with either vehicle (H) or AAV-amiR-Atxn2 (I) compared to wild-type animals treated with vehicle (n = 6). Red and dark blue dots represent upregulated and downregulated genes, respectively, with > twofold change and padj < 0.05. Orange and light blue dots represent significantly upregulated and downregulated genes, respectively, with < twofold change and padj < 0.05. J Correlation of gene expression changes when PFN1C71G vehicle treated animals are compared to wild-type vehicle treated or PFN1C71G AAV-amiR-Atxn2 treated mice. Pearson correlation coefficient (r) was used to determine the linear correlation between the two conditions. Purple dots represent genes that were significantly changed (padj < 0.05) in either condition. Grey dots represent genes that had a padj > 0.05 in both conditions. K Bubble plot of the top 20 gene ontology (GO) terms based on dysregulated genes that have a ≥ twofold change and padj < 0.05 in the skeletal muscle of PFN1C71G mice. L Heatmap of gene expression changes in GO immune response across groups. M Enriched hallmark gene sets based on dysregulated genes that have a ≥ twofold change and padj < 0.05 in the skeletal muscle of PFN1C71G mice. N Heatmap of gene expression changes in the myogenesis hallmark gene set across groups
Fig. 6
Fig. 6
WGCNA identifies preserved expression changes in the spinal cord of PFN1C71G transgenic mice and individuals with ALS. A Heatmaps showing gene expression changes in PFN1C71G spinal cord of transcripts identified to be dysregulated in different ALS spinal cord regions (cervical, thoracic, and lumbar). B Module eigen genes from PFN1C71G mice in vehicle-treated WT and PFN1C71G mice and AAV-amiR-Atxn2-treated PFN1C71G mice. *Signifies that the adjusted p value of t-test is < 0.05. C Left: preservation score of PFN1C71G mice modules in sporadic ALS from University of Miami dataset. Right: lightcoral and mediumpurple2 module eigen genes in sporadic ALS. D Left: preservation score of PFN1C71G mice modules in C9orf72 Target ALS dataset. Right: lightcoral and mediumpurple2 module eigen genes in C9orf72 Target ALS. E Left: preservation score of PFN1C71G mice modules in SOD1 Target ALS dataset. Right: lightcoral and mediumpurple2 module eigen genes in SOD1 Target ALS. F Overlapped lightcoral module hub genes and DEGs in PFN1C71G mice vs WT mice and human ALS vs control dataset. G Overlapped mediumpurple2 module hub genes and DEGs in PFN1C71G mice vs WT mice and human ALS vs control dataset

References

    1. Oskarsson B, Gendron TF, Staff NP (2018) Amyotrophic lateral sclerosis: an update for 2018. Mayo Clin Proc 93:1617–1628 - PubMed
    1. Neumann M et al (2009) Phosphorylation of S409/410 of TDP-43 is a consistent feature in all sporadic and familial forms of TDP-43 proteinopathies. Acta Neuropathol 117:137–149 - PMC - PubMed
    1. Klim JR et al (2019) ALS-implicated protein TDP-43 sustains levels of STMN2, a mediator of motor neuron growth and repair. Nat Neurosci 22:167–179 - PMC - PubMed
    1. Barmada SJ et al (2010) Cytoplasmic mislocalization of TDP-43 is toxic to neurons and enhanced by a mutation associated with familial amyotrophic lateral sclerosis. J Neurosci 30:639–649 - PMC - PubMed
    1. Kabashi E et al (2010) Gain and loss of function of ALS-related mutations of TARDBP (TDP-43) cause motor deficits in vivo. Hum Mol Genet 19:671–683 - PubMed

Publication types

MeSH terms

LinkOut - more resources