. 2025 May;15(5):e70348.
doi: 10.1002/ctm2.70348.

Microbial metabolism mediates the deteriorative effects of sedentary behaviour on insulin resistance

Affiliations

Microbial metabolism mediates the deteriorative effects of sedentary behaviour on insulin resistance

Jingmeng Ju et al. Clin Transl Med. 2025 May.

Abstract

Background: Prolonged sedentary time is a strong risk factor for insulin resistance. Recent evidence indicates that gut microbiota may influence the regulation of insulin sensitivity and demonstrates a distinct profile between sedentary and physically active individuals. However, whether and how microbial metabolism mediates the progression of insulin resistance induced by prolonged sedentary time remains unclear.

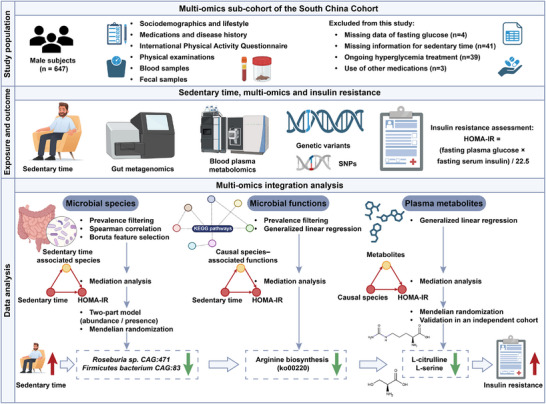
Methods: 560 male participants without hypoglycaemic therapy were included, and insulin resistance was evaluated using the Homeostatic Model Assessment of Insulin Resistance (HOMA-IR). The gut microbiota was identified through metagenomics, host genetic data were obtained using a genotyping array, and plasma metabolites were quantified by liquid chromatography mass spectrometry.

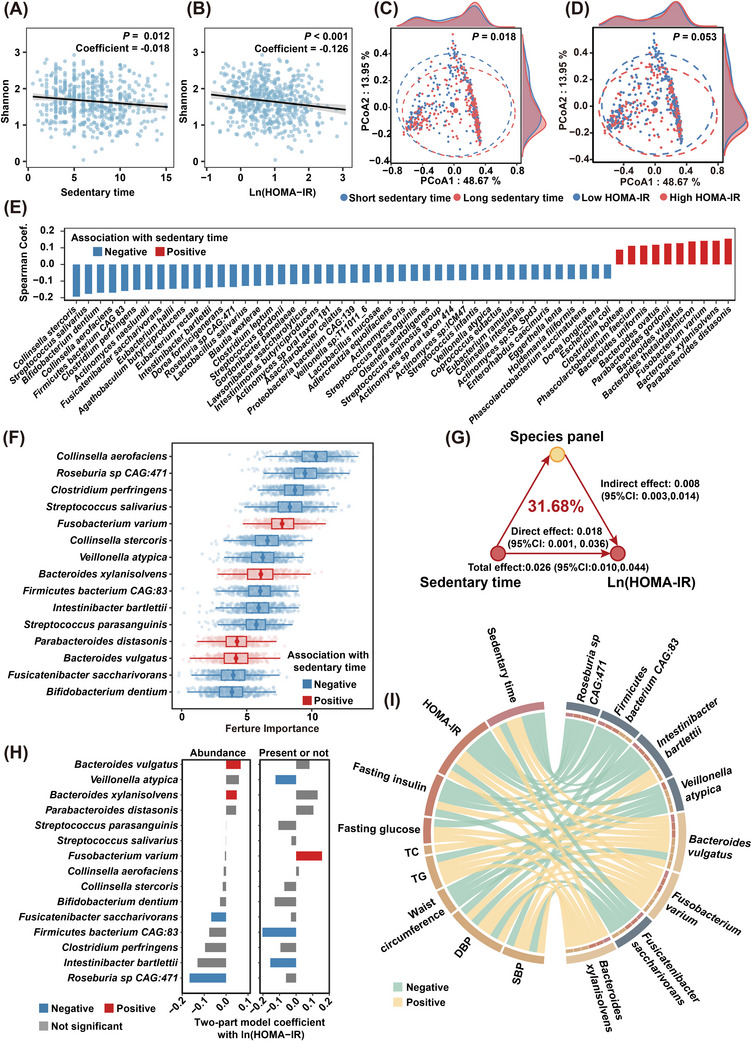
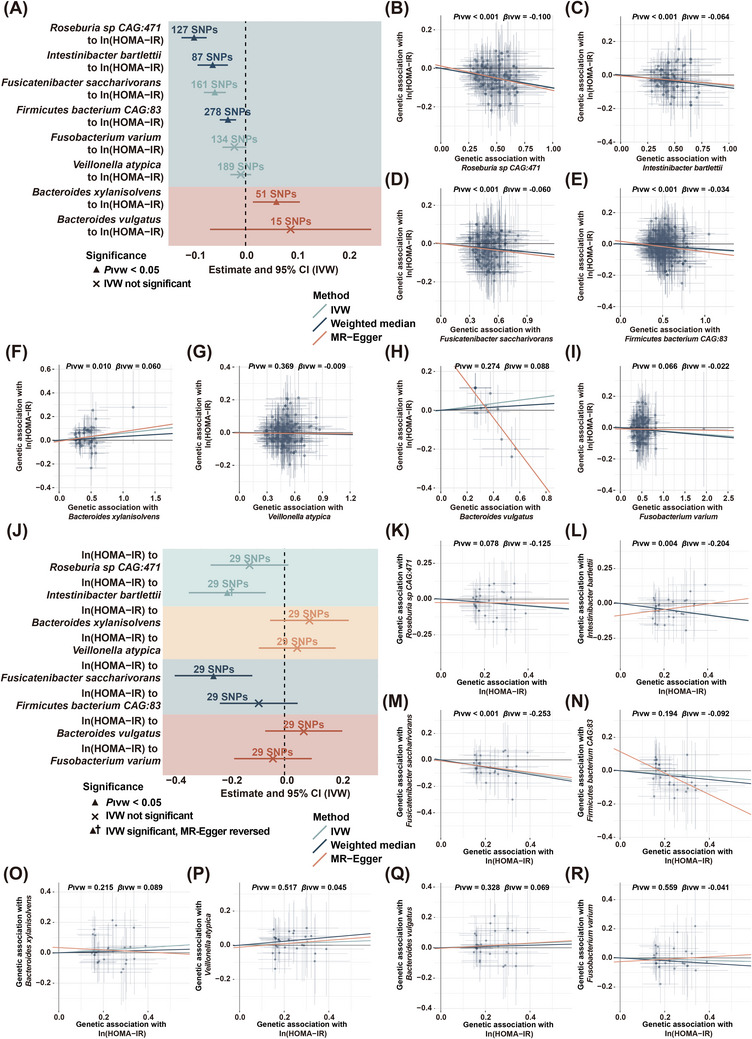
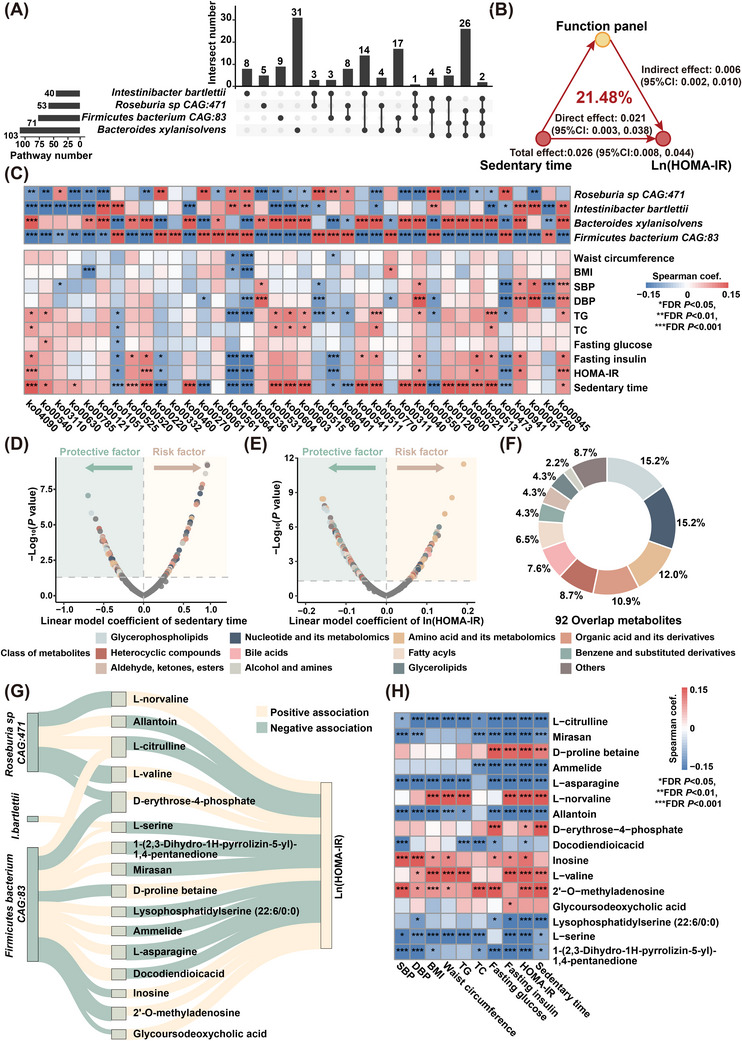
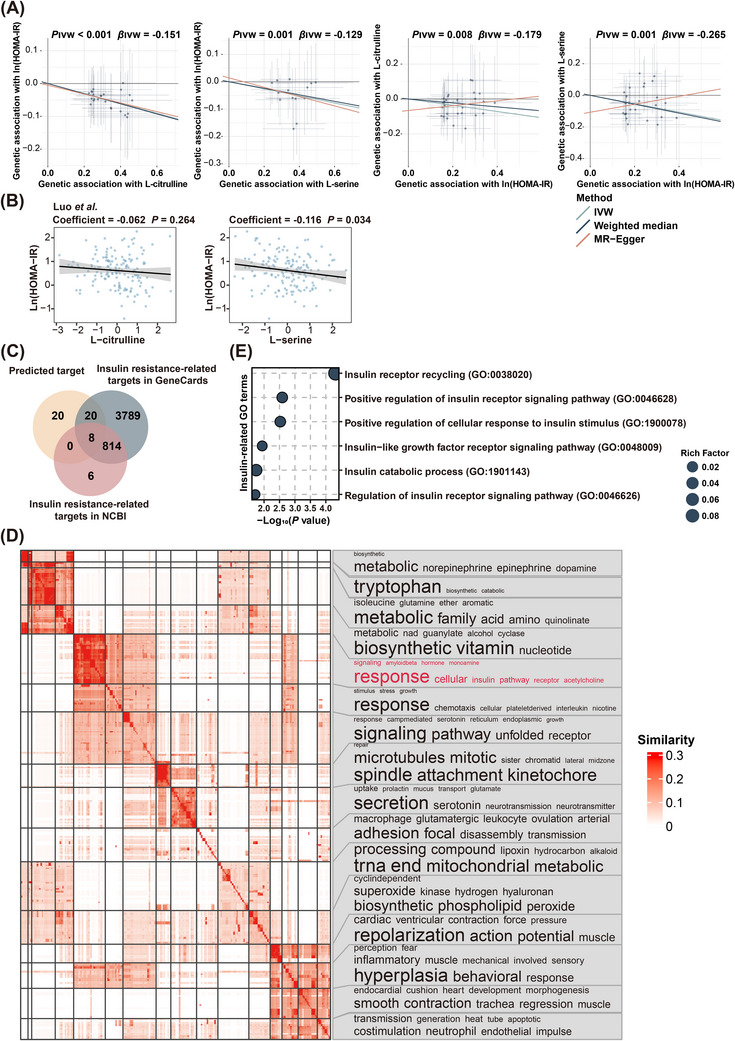
Results: A panel of 15 sedentary-related species and 38 sedentary-associated metabolic capacities accounted for 31.68% and 21.48% of the sedentary time-related variation in HOMA-IR, respectively. Specifically, decreased Roseburia sp. CAG:471, Intestinibacter bartlettii, and Firmicutes bacterium CAG:83, but increased Bacteroides xylanisolvens related to longer sedentary time, were causally linked to the development of insulin resistance. Furthermore, integrative analysis with metabolomics identified reduced L-citrulline and L-serine, resulting from a suppression of arginine biosynthesis as key microbial effectors linking longer sedentary time to enhanced insulin resistance.

Conclusions: In summary, our findings provide insights into the mediating role of gut microbiota on the progression of insulin resistance induced by excessive sedentary time, and highlight the possibility of counteracting the detrimental effect of prolonged sedentary time on insulin resistance by microbiota-modifying interventions.

Key points: Prolonged sedentary time leads to a depletion of Roseburia sp. CAG:471 and Firmicutes bacterium CAG:83, and suppresses arginine biosynthesis. Decreased L-citrulline and L-serine function as key microbial effectors mediating the adverse effect of sedentary time on insulin sensitivity. Targeting gut microbiota holds promise to combat insulin resistance induced by excessive sedentary time.

Keywords: Mendelian randomisation; gut microbiota; insulin resistance; sedentary behaviour.


Conflict of interest statement

The authors declare no conflicts of interest.

Figures

FIGURE 1
FIGURE 1
Flowchart of the study. 560 male individuals free of hypoglycaemic treatment and antibiotics use prior to sample collection were included, and subjected to integrative analysis of fecal metagenomic sequencing, genotyping, and plasma metabolomics.
FIGURE 2
FIGURE 2
Microbial species partially mediate the effect of sedentary time on insulin resistance. Association of alpha diversity with (A) sedentary time and (B) HOMA‐IR (n = 560). The p‐values were derived from linear models and were adjusted for age, BMI, smoking, drinking, diet diversity, educational attainment and household income. (C, D) Principal Coordinates Analysis plots of beta diversity of gut microbiota at genus level based on Bray–Curtis distance (p calculated by PERMANOVA), stratified by the median value of (C) sedentary time and by a threshold of 2.5 for (D) HOMA‐IR. (E) Species significantly correlated with sedentary time. (F) Boxplots of the normalised permutated variable importance of species associated with sedentary time. Significant species were identified by the random forest‐based machine learning variable selection algorithm Boruta using 1000 trees, 500 iterations, with FDR < .05. Since Boruta only provided feature importance without directions, the directions of the association with sedentary time were determined by the coefficient in E. (G) Estimates of the mediation effect of the species identified in F on the association between sedentary time and HOMA‐IR, adjusted for the same variables in A. (H) Species significantly associated with HOMA‐IR, determined by a two‐part model adjusted for the same variables in A. Blue, red and grey indicated negative, positive and insignificant correlations with HOMA‐IR, respectively. (I) The chord diagram showing the associations between clinical phenotypes and species identified in H, after adjustment for the same covariates in A. Yellow and green indicated positive and negative associations derived from the two‐part model. For clarity, only significant associations with FDR p < .05 were shown.
FIGURE 3
FIGURE 3
Causal links between selected species and HOMA‐IR. (A) The forest plot showing the potential causal associations observed between selected species and HOMA‐IR (n = 554). Data were presented as beta coefficients with corresponding 95% confidence intervals. (B–I) Scatterplot of associations between genetic variants and selected species including (B) Roseburia sp CAG:471, (C) Intestinibacter bartlettii, (D) Fusicatenibacter saccharivorans, (E) Firmicutes bacterium CAG:83, (F) Bacteroides xylanisolvens, (G) Veillonella atypica, (H) Bacteroides vulgatus and (I) Fusobacterium varium versus between genetic variants and HOMA‐IR. The slope of each line corresponded to the estimated Mendelian Randomisation effect. (J) The forest plot showing the potential causal associations observed between HOMA‐IR and selected species (n = 554). (K–R) Scatterplot of associations between genetic variants and HOMA‐IR versus between genetic variants and selected species including (K) Roseburia sp CAG:471, (L) Intestinibacter bartlettii, (M) Fusicatenibacter saccharivorans, (N) Firmicutes bacterium CAG:83, (O) Bacteroides xylanisolvens, (P) Veillonella atypica, (Q) Bacteroides vulgatus and (R) Fusobacterium varium.
FIGURE 4
FIGURE 4
Sedentary‐associated microbial functions and metabolites are closely associated with HOMA‐IR (A) Upset plot showing the overlap of microbial functions significantly associated with selected species (n = 560). Generalised linear model was adopted, adjusting for age, BMI, smoking, drinking, diet diversity, educational attainment and household income. (B) Estimates of the mediation effect of selected microbial functions on the association between sedentary time and HOMA‐IR. Mediation analyses were adjusted for the same covariates in A. (C) Heatmap showing the correlation between clinical indices and microbial functions that were significantly associated with at least three species shown in A. For clarity, only microbial functions and clinical indices with at least one significant correlation (*FDR p < .05, **FDR p < .01, ***FDR p < .001) were shown. Metabolites significantly associated with (D) sedentary time and (E) HOMA‐IR, identified after adjustment for the same covariates in A. FDR p < .05 was considered significant. Nodes were coloured based on the Class I classification of metabolites. (F) Pie chart showing the distribution of metabolites that were significantly associated with both sedentary time and HOMA‐IR, with consistent directionality of the associations. (G) Mediation linkages among selected species, plasma metabolites and HOMA‐IR were adjusted for the same covariates as in A, and significance was assessed after FDR correction. Yellow and green lines indicated positive and negative correlations, respectively. The thickness of the lines was proportional to the absolute value of the strength of association. (H) Heatmap showing the correlation between clinical indices and plasma metabolites identified in G.
FIGURE 5
FIGURE 5
Schematic diagram illustrating how prolonged sedentary time suppresses the microbial production of L‐citrulline and L‐serine. (A, B) Prolonged sedentary time led to a reduction in Roseburia sp CAG:471 and Firmicutes bacterium CAG:83, which encoded key enzymes responsible for (A) arginine biosynthesis and (B) glycine, serine and threonine metabolism (n = 560). The downregulation of arginine biosynthesis and glycine, serine and threonine metabolism led to a decreased production of L‐citrulline and L‐serine, which in turn enhanced insulin resistance.
FIGURE 6
FIGURE 6
Causal links between L‐citrulline, L‐serine and insulin resistance. (A) Scatterplot of associations between genetic variants and selected metabolites versus between genetic variants and HOMA‐IR (n = 554). The slope of each line corresponded to the estimated Mendelian Randomisation effect. (B) Associations of the abundance of L‐citrulline and L‐serine with HOMA‐IR in an independent validation cohort. (C) Overlap of potential downstream targets of L‐citrulline and L‐serine with genes related to insulin resistance in National Center for Biotechnology Information and GeneCards repositories. (D) Similarity clustering heatmap for enriched pathways with term frequencies exhibited by font size in biological processes. (E) Significantly enriched Gene Ontology terms related to insulin signalling pathway.

Similar articles

References

    1. Lee SH, Park SY, Choi CS. Insulin resistance: from mechanisms to therapeutic strategies. Diabetes Metab J. 2022;46:15‐37. - PMC - PubMed
    1. Yaribeygi H, Maleki M, Sathyapalan T, Jamialahmadi T, Sahebkar A. Pathophysiology of physical inactivity‐dependent insulin resistance: a theoretical mechanistic review emphasizing clinical evidence. J Diabetes Res. 2021;2021:7796727. - PMC - PubMed
    1. Pinto AJ, Bergouignan A, Dempsey PC, et al. Physiology of sedentary behavior. Physiol Rev. 2023;103:2561‐2622. - PMC - PubMed
    1. Helmerhorst HJ, Wijndaele K, Brage S, Wareham NJ, Ekelund U. Objectively measured sedentary time may predict insulin resistance independent of moderate‐ and vigorous‐intensity physical activity. Diabetes. 2009;58:1776‐1779. - PMC - PubMed
    1. Dempsey PC, Larsen RN, Winkler EAH, Owen N, Kingwell BA, Dunstan DW. Prolonged uninterrupted sitting elevates postprandial hyperglycaemia proportional to degree of insulin resistance. Diabetes Obes Metab. 2018;20:1526‐1530. - PubMed

LinkOut - more resources