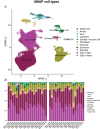
The skeletal muscle response to high-intensity training assessed by single-nucleus RNA-sequencing is blunted in individuals with type 2 diabetes
- PMID: 40413649
- PMCID: PMC12148207
- DOI: 10.1113/JP288368
The skeletal muscle response to high-intensity training assessed by single-nucleus RNA-sequencing is blunted in individuals with type 2 diabetes
Abstract
Training can improve insulin sensitivity in individuals with type 2 diabetes, but a clear understanding of the mechanisms remains elusive. To further our knowledge in this area, we aimed to examine the effect of type 2 diabetes and of high-intensity interval training (HIIT) on the nuclear transcriptional response in skeletal muscle. We performed single-nucleus RNA-sequencing (snRNA-seq) and immunofluorescence analysis on muscle biopsies from the trained and the untrained legs of participants with and without type 2 diabetes, after 2 weeks of one-legged HIIT on a cycle ergometer. Surprisingly, the type 2 diabetes condition only seemed to have a minor effect on transcriptional activity in myonuclei related to major metabolic pathways when comparing the untrained legs. However, while in particular the type IIA myonuclei in the control group displayed a considerable metabolic response to HIIT, with increases in genes related to glycogen breakdown and glycolysis primarily in the type IIA myonuclei of the trained leg, this response was blunted in the diabetes group, despite a marked increase in glucose clearance in both groups. Additionally, we observed that fibre type distribution assessed by immunofluorescence significantly correlated with the proportion of myonuclei in the snRNA-seq analysis. In conclusion, the type 2 diabetes condition blunts the metabolic transcriptional response to HIIT in the type IIA myonuclei without affecting the improvement in insulin sensitivity. Additionally, our results indicate that snRNA-seq can be used as a surrogate marker for fibre type distribution in sedentary middle-aged adults. KEY POINTS: The study utilized single-nucleus RNA sequencing (snRNA-seq) to analyse 38 skeletal muscle biopsies, revealing distinct transcriptional profiles in myonuclei from individuals with and without type 2 diabetes (T2D) after 2 weeks of HIIT. snRNA-seq identified significant differences in gene expression, with 14 differentially expressed genes (DEGs) in type IIA myonuclei of the control group, specifically related to glycogen breakdown and glycolysis, which were blunted in the T2D group. In the control group, HIIT induced a substantial transcriptional response in type IIA myonuclei, enhancing metabolic pathways associated with insulin sensitivity, while the T2D group showed minimal transcriptional changes despite improved insulin sensitivity. The T2D group exhibited a blunted response in metabolic gene expression, indicating that the training effect on muscle adaptation was significantly impaired compared to healthy controls. Overall, the findings highlight the differential impact of HIIT on muscle metabolism, emphasizing the need for tailored exercise interventions for individuals with T2D.
Keywords: HIIT; glucose metabolism; snRNA‐seq; training; type 2 diabetes.
© 2025 The Author(s). The Journal of Physiology published by John Wiley & Sons Ltd on behalf of The Physiological Society.
Conflict of interest statement
The authors declared the following potential conflicts of interest with respect to research, authorship and/or publication of this article: Julius Elliot Raagaard Grothen, Nikos Sidiropoulos and Thomas Åskov Pedersen are paid employees at Novo Nordisk.
Figures


References
-
- 10X Genomics . (2020). https://www.10xgenomics.com/support/software/cell-ranger/latest/release-...
-
- Blaauw, B. , Schiaffino, S. , & Reggiani, C. (2013). Mechanisms modulating skeletal muscle phenotype. Comprehensive Physiology, 3(4), 1645–1687. - PubMed
-
- Bouchard, C. , Blair, S. N. , Church, T. S. , Earnest, C. P. , Hagberg, J. M. , Häkkinen, K. , Jenkins, N. T. , Karavirta, L. , Kraus, W. E. , Leon, A. S. , Rao, D. C. , Sarzynski, M. A. , Skinner, J. S. , Slentz, C. A. , & Rankinen, T. (2012). Adverse metabolic response to regular exercise: Is it a rare or common occurrence?. PLoS ONE, 7(5), e37887. - PMC - PubMed
-
- Casal‐Dominguez, M. , Pinal‐Fernandez, I. , Pak, K. , Muñoz‐Braceras, S. , Milisenda, J. C. , Torres‐Ruiz, J. , Dell′Orso, S. , Naz, F. , Gutierrez‐Cruz, G. , Duque‐Jaimez, Y. , Matas‐Garcia, A. , Valls‐Roca, L. , Garrabou, G. , Trallero‐Araguas, E. , Walitt, B. , Christopher‐Stine, L. , Lloyd, T. E. , Paik, J. J. , Albayda, J. , … Mammen, A. L. (2023). Coordinated local RNA overexpression of complement induced by interferon gamma in myositis. Scientific Reports, 13(1), 2038. - PMC - PubMed
MeSH terms
Grants and funding
LinkOut - more resources
Full Text Sources
Medical
