. 2025 Dec;17(1):2508433.
doi: 10.1080/19490976.2025.2508433. Epub 2025 May 25.

Bacteroides uniformis-generated hexadecanedioic acid ameliorates metabolic-associated fatty liver disease

Affiliations

Bacteroides uniformis-generated hexadecanedioic acid ameliorates metabolic-associated fatty liver disease

Da-Ya Zhang et al. Gut Microbes. 2025 Dec.

Abstract

Gut microbiota exerts a pivotal influence on the development of Metabolic Associated Fatty Liver Disease (MAFLD), although the specific contributions of individual bacterial strains and their metabolites remain poorly defined. We conducted stool shotgun metagenomic sequencing and plasma untargeted metabolomics in a large prospective cohort comprising 120 MAFLD patients and 120 matched healthy controls. The mechanisms and microbial-derived metabolites involved in MAFLD were further investigated through multi-omics analyses in vitro and in vivo. Distinct differences were identified in both the microbial community structure and metabolomic profiles between MAFLD patients and healthy controls. Bacteroides uniformis (B. uniformis) was the most significantly depleted species in MAFLD and negatively correlated with hepatic steatosis and BMI. MAFLD was characterized by marked disruptions in fatty acid and amino acid metabolism. Combined analysis of metabolomic and metagenomic data achieved high diagnostic accuracy for MAFLD and hepatic steatosis severity (AUC = 0.93). Transplantation of fecal microbiota from MAFLD subjects into ABX mice led to the onset of MAFLD-like symptoms, whereas B. uniformis administration alleviate disease progression by inhibiting intestinal fat absorption, FFA from eWAT influx into liver via the gut-liver axis, and IRE1α-XBP1s-mediated flipogenesis and ferroptosis, as confirmed by hepatic transcriptomic and proteomic analyses. Hexadecanedioic acid (HDA), potentially identified as a key metabolite produced by B. uniformis, ameliorated MAFLD symptoms. Mechanistically, B. uniformis-derived HDA also inhibited fat absorption and transported, and entered the liver via the portal vein to suppress IRE1α-XBP1s-mediated flipogenesis and ferroptosis. B. uniformis and its potential putative metabolite HDA may contribute to MAFLD progression modulation, through regulation of the IRE1α-XBP1s axis. This study provides new insights into the gut-liver axis in MAFLD and offers promising therapeutic targets based on specific microbes and their metabolites.

Keywords: Bacteroides uniformis; gut microbiota; hexadecanedioic acid; lipid metabolites; metabolic associated fatty liver disease; metabolomics.


Conflict of interest statement

No potential conflict of interest was reported by the author(s).

Figures
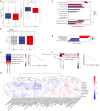
Figure 1.
Figure 1.
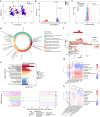
Diversity and compositional differences in the gut microbiome between HC and MAFLD patients. (a) Alpha diversity analysis comparing microbial community richness (observed species) and evenness (Shannon index) between the HC and MAFLD groups. (b) Beta diversity differences assessed using analysis of similarities (ANOSIM) based on metagenomic sequencing data at the species level, revealing significant separation between groups. (c) Species-level differential abundance analysis performed using the Wilcoxon rank-sum test, with results displayed as a bar plot highlighting statistically significant taxa. (d) Linear discriminant analysis (LDA) effect size (LEfSe) identifying microbial biomarkers that discriminate between HC and MAFLD groups based on phylogenetic and abundance differences. (e) Heatmap visualization of common characteristic bacterial species and their relative abundance in mild MAFLD (miMAFLD) and severe MAFLD (msMAFLD) compared to HC. (f) Heatmap comparison of shared bacterial signatures and their abundance profiles between non-obese MAFLD (nobMAFLD) and obese MAFLD (obMAFLD) versus HC. (g) Correlation network analysis illustrating associations between differentially abundant microbial species and key clinical parameters (e.g., liver enzymes, lipid profiles). The analysis included 120 healthy controls (HC) and 120 metabolic-associated fatty liver disease (MAFLD) patients, matched for age, sex, etc.
Figure 2.
Figure 2.
Serum metabolic profiling reveals distinct alterations in MAFLD patients compared to HC. (a) Principal component analysis (PCA) score plot illustrating the global metabolic differences between the HC and MAFLD groups, highlighting distinct clustering patterns. (b) Orthogonal partial least squares-discriminant analysis (OPLS-DA) permutation test (n = 200) demonstrating model validity, with the histogram showing the distribution of permuted R2 and Q2 values compared to the original model. (c) Volcano plot displaying the differential serum metabolites between HC and MAFLD, with each point representing a metabolite (x-axis: log₂ Fold change; y-axis: −log₁₀ p-value). Significantly altered metabolites (p < 0.05, Fold change > 1.5) are highlighted. (d) Hierarchical classification of differential metabolites based on the human metabolome database (HMDB), categorizing them into major chemical classes (e.g., lipids, amino acids, organic acids). (e) Kyoto Encyclopedia of genes and genomes (KEGG) pathway enrichment analysis of the differentially abundant metabolites, identifying key metabolic pathways dysregulated or upregulated in MAFLD. (f) Pathway impact analysis bubble plot integrating pathway enrichment (y-axis: −in p-value) and topological importance (x-axis: pathway impact score), with bubble size representing metabolite count. (g) Spearman correlation heatmap depicting associations between the top 10 significantly altered metabolites and clinical indices (e.g., liver enzymes, lipid profiles). (h) Microbial-metabolite correlation network revealing significant relationships (|r| > 0.5, p < 0.05) between key gut bacterial species (from Figure 1) and the top differential serum metabolites. The analysis included 120 healthy controls (HC) and 120 metabolic-associated fatty liver disease (MAFLD) patients, matched for age, sex, etc.
Figure 3.
Figure 3.
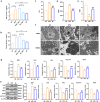
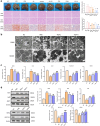
Effect of fecal microbiota transplantation (FMT) and Bacteroides uniformis supplementation on obesity and liver histopathology in HFD-induced MAFLD mice. (a) Experimental timeline illustrating the study design, including duration of antibiotic sustained cleansing, HFD feeding duration, FMT/B. uniformis intervention periods, n = 8 for each group. Pilot histology: At 11 weeks, a representative liver from each group underwent H&E/Oil red O/Masson staining, confirming both steatosis induction and treatment efficacy. (b) Body weight trajectories across experimental groups, demonstrating the impact of interventions on obesity progression, n = 7 for each group, n = 8 for each group. (c) Absolute liver weight measured at endpoint, showing significant differences between treatment groups and HFD controls, n = 7 for each group. (d) liver index calculated as (liver weight/body weight)×100%, reflecting hepatomegaly severity, n = 7 for each group. (e) Epididymal white adipose tissue (eWAT) mass, a marker of visceral adiposity, compared among experimental groups, n = 7 for each group. (f) Epididymal white adipose tissue (eWAT) index expressed as (eWAT weight/body weight)×100%, quantifying fat accumulation differences, n = 7 for each group. (g) Representative photomicrographs of liver sections stained with: H&E: revealing histopathological changes (steatosis, inflammation, ballooning); oil red O: quantifying neutral lipid deposition, n = 3 for each group. Statistical significance versus HFD group, *p < 0.05, **p < 0.01, ***p < 0.001(one-way ANOVA with post-hoc Dunnett’s test).
Figure 4.
Figure 4.
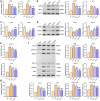
B. uniformis inhibited fat absorption and transported, and IRE1α-XBP1-mediated flipogenesis. (a) Ileum mRNA expression profiles of fat absorption and transported-related genes (CD36, MTP) (n = 3 for each group). (b) Quantitative analysis of WesternBlot banding plots of CD36, MTP proteins in the ileum of mice and the gray value of protein expression levels (n = 3 for each group). (c) White adipose tissue (eWAT) mRNA expression profiles of fatty acid handling-related genes (PPARγand FABP4) (n = 3 for each group). (d) Quantitative analysis of WesternBlot banding plots of PPARγand FABP4 proteins in the eWAT of mice and the gray value of protein expression levels (n = 3 for each group). (e) Liver mRNA expression profiles of flipogenesis-related genes (DGAT2 and MTP) (n = 3 for each group). (f) Quantitative analysis of WesternBlot banding plots of p-IRE1α, p-IRE1α/IRE1α ratio, XBP1s, XBP1u, XBP1s/XBP1u ratio, DGAT2, and MTP proteins in the liver of mice and the gray value of protein expression levels (n = 3 for each group). (g) Serum VLDL, n = 8 for each group. Statistical significance: compared with the NC group, *p < 0.05, **p < 0.01, ***p < 0.001. Compared with the HFD group, #p < 0.05, # #p < 0.01, # # # p < 0.001.
Figure 5.
Figure 5.
Bu attenuates ferroptosis and ameliorates MAFLD progression in mice. (a) Serum Fe2+ of mice in different groups(n = 8 for each group). (b) Serum ferritin of mice in different groups(n = 8 for each group). (c) Liver Fe2+ of mice in different groups(n = 3 for each group). (d) Reactive oxygen species (ROS) levels in liver tissues in different groups(n = 3 for each group). (e) Liver glutathione (GSH) levels of mice in different groups(n = 3 for each group). (f) Representative transmission electron microscopy (TEM) images of liver ultrastructure (n = 3 for each group). (g) Liver mRNA expression profiles of ferroptosis-related genes (XBP1, Nrf2, Hrd1, SLC7A11, GPX4) (n = 3 for each group). (h) quantitative analysis of WesternBlot banding plots of XBP1, Nrf2, Hrd1, SLC7A11, and GPX4 proteins in the liver of mice and the gray value of protein expression levels (n = 3 for each group). (a-b) Statistical significance: (*p < 0.05, **p < 0.01, ***p < 0.001, and ****p < 0.0001, two subgroups were compared separately: NC vs HFD vs Bu, MAF_FMT vs HC_FMT). (c-h)Statistical significance: compared with the NC group, *p < 0.05, **p < 0.01, ***p < 0.001. Compared with the HFD group, #p < 0.05, # #p < 0.01, # # # p < 0.001.
Figure 6.
Figure 6.
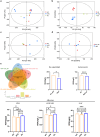
Metabolomics identifies HDA as the key bioactive metabolite mediating the therapeutic effects of Bu in MAFLD mice. (a) Principal component analysis (PCA) of stool metabolomic profiles across experimental groups, n = 5 for each group. (b) PCA of portal vein plasma metabolites, n = 5 for each group. (c) Hepatic metabolic profiling by PCA, n = 3 for each group. (d) PCA of Bu supernatant metabolites, n = 3 for each group. (e) Intersection of metabolites and HDA quantification from different sample sources. Venn diagram illustrating overlapping metabolites among different biological matrices. HDA level in the portal vein, stool, and liver of B. uniform-gavaged and PBS-gavaged germ-free mice. HDA level between HC and MAFLD groups. HDA level between B. uniform and Columbia blood agar groups. (*p < 0.05, **p < 0.01, ***p < 0.001, and ****p < 0.0001).
Figure 7.
Figure 7.
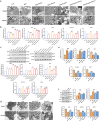
HDA attenuates ferroptosis in MAFLD through XBP1 regulation. (a) Representative transmission electron micrographs of hepatic ultrastructure in HepG2 MAFLD models following HDA treatment(n = 3 for each group). (b) qRT-PCR analysis of ferroptosis-related genes (XBP1, Nrf2, Hrd1, SLC7A11, GPX4) in HDA-treated HepG2 MAFLD cells(n = 3 for each group). (c) Quantitative Western blot analysis of corresponding protein expression levels (normalized band intensities shown)(n = 3 for each group). (d) liver electron microscopy of mice in HepG2 MAFLD cell model with knockdown of XBP1 added(n = 3 for each group). (e) Effects of HDA on mRNA expression levels of XBP1, Nrf2, Hrd1, SLC7A11, GPX4 in HepG2 MAFLD cell model with knockdown of XBP1 added(n = 3 for each group). (f) quantitative analysis of WesternBlot banding plots of XBP1, Nrf2, Hrd1, SLC7A11, and GPX4 proteins in HepG2 MAFLD cell model with knockdown of XBP1 added(n = 3 for each group). Statistical significance: (a-c)***p < 0.001, ****p < 0.0001 vs control; ##p < 0.01, ####p < 0.0001 vs model; &p < 0.05, &&p < 0.01, &&&&p < 0.0001 vs model+Erastin. (D-F) ***p < 0.001 vs control; ##p < 0.01 vs model.
Figure 8.
Figure 8.
HDA attenuates mitochondrial ferroptosis in MAFLD mouse hepatic cells during MAFLD progression. (a) Histopathological evaluation of liver sections by hematoxylin-eosin (H&E) and lipid deposition by oil red O staining across experimental cohorts(n = 3 for each group). (b) Ultrastructural examination of hepatocytes via transmission electron microscopy(n = 3 for each group). (c) Relative mRNA abundance of ferroptosis-associated genes (XBP1, NRF2, HRD1, SLC7A11, GPX4) in hepatic tissues(n = 3 for each group). (d) Quantitative immunoblot analysis of corresponding protein expression, with band intensities normalized to reference controls(n = 3 for each group). Statistical analyses: *p < 0.05, **p < 0.01, ***p < 0.001 versus normal control (NC) group; #p < 0.05, ##p < 0.01, ###p < 0.001 versus phosphate buffer saline(PBS) group.
Figure 9.
Figure 9.
HDA inhibited fat absorption and transported, and IRE1α-XBP1-mediated flipogenesis. (a) ileum mRNA expression profiles of fat absorption and transported-related genes (CD36, MTP) (n = 3 for each group). (b) quantitative analysis of WesternBlot banding plots of CD36, MTP proteins in the ileum of mice and the gray value of protein expression levels (n = 3 for each group). (c) white adipose tissue (eWAT) mRNA expression profiles of fatty acid handling-related genes (PPARγand FABP4) (n = 3 for each group). (d) quantitative analysis of WesternBlot banding plots of PPARγand FABP4 proteins in the eWAT of mice and the gray value of protein expression levels (n = 3 for each group). (e) liver mRNA expression profiles of flipogenesis-related genes (DGAT2 and MTP) (n = 3 for each group). (f) quantitative analysis of WesternBlot banding plots of p-IRE1α, p-IRE1α/IRE1α ratio, XBP1s, XBP1u, XBP1s/XBP1u ratio, DGAT2, and MTP proteins in the liver of mice and the gray value of protein expression levels (n = 3 for each group). (g) serum VLDL. Statistical significance: compared with the NC group, *p < 0.05, **p < 0.01, ***p < 0.001. Compared with the PBS group, #p < 0.05, # #p < 0.01, # # # p < 0.001.

References

    1. Zhou J, Zhou F, Wang W, Zhang XJ, Ji YX, Zhang P, She ZG, Zhu L, Cai J, Li H.. Epidemiological features of NAFLD from 1999 to 2018 in China. Hepatology. 2020;71(5):1851–26. doi: 10.1002/hep.31150. - DOI - PubMed
    1. Younossi Z, Tacke F, Arrese M, Chander Sharma B, Mostafa I, Bugianesi E, Wai-Sun Wong V, Yilmaz Y, George J, Fan J, et al. Global perspectives on nonalcoholic fatty liver disease and nonalcoholic Steatohepatitis. Hepatology. 2019;69(6):2672–2682. doi: 10.1002/hep.30251. - DOI - PubMed
    1. Li J, Zou B, Yeo YH, Feng Y, Xie X, Lee DH, Fujii H, Wu Y, Kam LY, Ji F, et al. Prevalence, incidence, and outcome of non-alcoholic fatty liver disease in Asia, 1999–2019: a systematic review and meta-analysis. Lancet Gastroenterol Hepatol. 2019;4(5):389–398. doi: 10.1016/S2468-1253(19)30039-1. - DOI - PubMed
    1. Younossi ZM, Koenig AB, Abdelatif D, Fazel Y, Henry L, Wymer M. Global epidemiology of nonalcoholic fatty liver disease—meta-analytic assessment of prevalence, incidence, and outcomes. Hepatology. 2016;64(1):73–84. doi: 10.1002/hep.28431. - DOI - PubMed
    1. Aron-Wisnewsky J, Vigliotti C, Witjes J, Le P, Holleboom AG, Verheij J, Nieuwdorp M, Clement K. Gut microbiota and human NAFLD: disentangling microbial signatures from metabolic disorders. Nat Rev Gastroenterol Hepatol. 2020;17(5):279–297. doi: 10.1038/s41575-020-0269-9. - DOI - PubMed

LinkOut - more resources