. 2025 Aug:66:101176.
doi: 10.1016/j.neo.2025.101176. Epub 2025 May 23.

PRMT1 inhibitor MS023 suppresses RNA splicing to sensitize small cell lung cancer to DNA damaging agents

Affiliations

PRMT1 inhibitor MS023 suppresses RNA splicing to sensitize small cell lung cancer to DNA damaging agents

Mansi K Aparnathi et al. Neoplasia. 2025 Aug.

Abstract

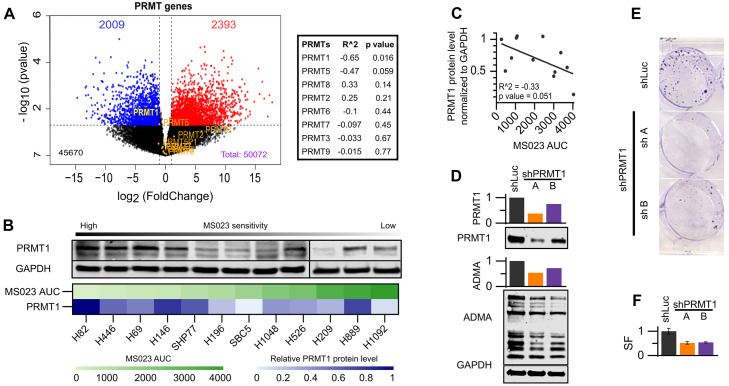
Small cell lung cancer (SCLC) is a highly aggressive form of cancer, commonly treated with DNA-damaging therapies such as chemotherapy and radiotherapy. Unfortunately, relapse occurs early and frequently, suggesting that epigenetic mechanisms may play a role in this aggressive behavior. Targeting these mechanisms during initial treatment could potentially enhance anti-cancer effects. This study investigated the combination of DNA-damaging treatments with a panel of Epigenetic Chemical Probes (EpiProbes). Among these, MS023, a PRMT inhibitor, showed the greatest synergy with cisplatin and etoposide across various SCLC cell lines. The cytotoxicity of MS023 was correlated with PRMT1 gene expression and protein levels. BioID analysis revealed that many PRMT1 interactors are involved in mRNA splicing. Mechanistic validation demonstrated that MS023 impaired RNA splicing, increased DNA:RNA hybrids, and caused DNA double-strand breaks (DSBs). When combined with ionizing radiation (IR), MS023 significantly increased DSBs, as indicated by γH2AX foci. Additionally, MS023 enhanced the effects of IR and the PARP inhibitor talazoparib, both in vitro and in vivo. Therefore, targeting PRMT1 in combination with DNA-damaging therapies presents a promising strategy to improve treatment outcomes for SCLC.

Keywords: Chemotherapy; Drug synergy; Epigenetics; PARP inhibitor; Radiation therapy; Small cell lung cancer, Poly(ADP-Ribose) polymerase.


Conflict of interest statement

Declaration of competing interest The authors declare the following financial interests/personal relationships which may be considered as potential competing interests: B.H. Lok reports grants from Pfizer and grants, personal fees, and nonfinancial support from AstraZeneca, and personal fees from Daiichi-Sankyo outside the submitted work. No other co-authors have any conflicts of interests to declare.

Figures

Fig 1:
Fig. 1
A screen for epigenetic chemo-sensitizers identified the PRMT1 inhibitor MS023 as the most potent candidate, with a broad range of sensitivities across multiple SCLC cell lines. Fig. 1A: Summary of EpiProbes used in the study and their function. Fig. 1B: Schematic workflow of experiments performed for generating data for 1C and 1D. Fig. 1C: Median bliss synergy score in 5 SCLC cell lines treated with EpiProbes in combination with 1:1 CDDP:ETS. MS023 was identified as the most potent chemo-sensitizer in this screen. Fig. 1D: Dose response curves of SCLC cell lines after treatment with MS023 for 10 days, with individual AUCs indicated in the legend. Individual points on the plots indicate the mean of three technical replicates with SD represented by error bars. Fig. 1E: Western blot showing reduction in ADMA across a panel of SCLC cell lines on treatment with 5μM MS023 for 72h.
Fig 2:
Fig. 2
Sensitivity of SCLC cell lines to MS023 is proportional to PRMT1 gene expression and protein levels. Fig. 2A: Volcano plot showing the relationship of gene expression with MS023 AUC in SCLC cell lines as log2 (Fold Change) and significance as -log10(pvalue). Of all the PRMTs, PRMT1 shows the most significant relationship with MS023 drug sensitivity. Table with p values and R square values derived from linear regression of expression levels of different PRMTs and MS023 sensitivity (AUC). Linear regression of PRMT1 expression levels and MS023 sensitivity (AUC) demonstrated significant correlation (p = 0.016, R^2 = 0.65). Fig. 2B: Western blot showing PRMT1 protein expression in SCLC cell lines. Fig. 2C: Linear regression of PRMT1 protein expression levels and MS023 sensitivity (AUC) demonstrated a strong correlative trend (p = 0.051). Figure legend Fig. 2D: Western blot showing PRMT1 knockdown and proportionate reduction in ADMA in SBC5 cell line. Fig. 2E: Representative image to demonstrate reduction in clonogenicity in SBC5 cells following the knockdown of PRMT1. Fig. 2F: Quantitative reduction in clonogenicity represented in the plot indicates the mean of three technical replicates with SD represented by error bars.
Fig 3:
Fig. 3
PRMT1 protein-protein interactome identifies role of PRMT1 in mRNA splicing, functionally validated by intron retention assay and immunoblotting of DNA:RNA hybrids. Fig. 3A: Schematic image of BioID pulldown assay with mt-BirA*-fused, flag-tagged PRMT1. Fig. 3B: BioID results: GO analysis of interactors of PRMT1 showing >2 Log fold increase in biotinylated peptide count in mt-BirA-PRMT1 as compared to mt-BirA*-EV in SBC5 cells. Fig. 3C: Working model tested in 3D, 3E and 3F. Briefly, inhibition of PRMT1 by MS023 leads to impaired splicing, resulting in retention of unresolved R-loops. Fig. 3D: Top: Vector with luciferase-intron (Luc-intron) was introduced in U2OS cells. Splicing proficient cells splice out intron leaving complete luciferase exon. Vector with pre-spliced luciferase (Luc-control) was also introduced into another set of cells as a control. Bottom: Retention of intron in cells transfected with Luc-intron vector showing impaired splicing in cells treated with MS023 (72h 5μM) and spliceosome inhibitor control (IsoG, 48h 5μM) as compared to DMSO control. Fig. 3E: R-loop, showing S9.6 antibody binding to DNA:RNA hybrids and RNAses (iii, T1 and H to digest dsRNA, ssRNA and DNA:RNA hybrids respectively). Fig. 3F: Immunofluorescence staining showing increased nuclear S9.6 (green) intensity in cells treated with MS023 (72h 5μM) and spliceosome inhibitor control (IsoG, 48h 5μM) as compared to DMSO control in SBC5 and H1048 cell lines. Quantification of S9.6 intensity is represented by violin plots taken from a minimum total of 150 cells in each treatment group. Scale bar: 10μm Figure legend Fig. 3G: Top: Dot blot probed with S9.6 antibody shows accumulation of unresolved R loops in cell lines treated with 5μM MS023 for 72h in H526, SBC5 and SHP77 cell lines. Prior to blotting on the nylon membrane nucleic acid was treated with a varying combination of RNAses as labeled to ascertain antibody specificity. A duplicate blot probed with anti-dsDNA antibody was used as loading control. Botton: Blot intensity normalized to dsDNA control.
Fig 4:
Fig. 4
Genetic knockdown and pharmacologic targeting of PRMT1 synergizes with IR and PARP inhibitor (talazoparib) in vitro Fig. 4A: Representative images of H446, H1048 and SBC5 cells treated with MS023 for 48 hours and/or 2 Gy IR after 6 hours recovery and stained for γH2AX. Quantification of γH2AX foci is represented by violin plots taken from a minimum total of 300 cells in each treatment group. Scale bar: 10μm Fig. 4B: Schematic of experimental design used to generate data for Fig. 4C and 4D. Fig. 4C: Clonogenic survival assays of LX22 and SBC5 and short-term viability assay of SHP77 demonstrates that shRNA knockdown of PRMT1 sensitizes cells to IR. Fig. 4D: Clonogenic survival assays of SBC5 and LX22 demonstrates that MS023 sensitizes SBC5 and LX22 cells to IR. (D0 – cells seeded, D1 – MS023, D3- IR). Fig. 4E: DMF values of experiments in Fig. 4C and 4D are tabulated. Fig. 4F: MS023 synergizes with talazoparib in SBC5 and SHP77 cell lines. (Drug combination response matric is set up as follows: D0 – cells seeded, D1 – MS023, D3- talazoparib added, D10- alamar blue readout). Relative synergy scores are color-coded where red indicates synergy. Most synergistic dose combination is determined by the Bliss MSAS synergy metric calculated using the values outlined in white boxes. Fig. 4G: Dose response curves at the intersection of the MSAS from the SHP77 matrix has been plotted with a fixed concentration of MS023-variable concentration of talazoparib and fixed concentration of talazoparib-variable concentration of MS023.
Fig 5:
Fig. 5
MS023 monotherapy is effective in a cell-line xenograft model and synergizes with radiation and PARP inhibitor in a patient-derived xenograft model. Fig. 5A: Tumor growth curves and Kaplan-Meier plots of H82 cell line derived xenograft model treated with vehicle control or 80mg/kg MS023 intraperitonially. Fig. 5B: Western blot showing reduction in asymmetric methylation in MS023- treated H82 in vivo cell line derived tumor model. Fig. 5C: Tumor growth curves and Kaplan-Meier plots of LX33 - CR PDX model treated with vehicle control, 80mg/kg MS023, 0.2 mg/kg talazoparib, 8 Gy radiation in four daily fractions (days 2-5), or the combination. Fig. 5D: Western blot showing reduction in ADMA and parylation in respective treatment groups of LX33 - CR tumor model. Fig. 5E: Schematic model summarising how MS023 synergizes with DDAs: PRMT1inhibition by MS023 leads to impaired splicing which results in accumulation of unresolved R-loops culminating into DNA DSBs, that increase multifold by addition of DDAs resulting into the observed synergistic effect.

References

    1. Sabari J.K., Lok B.H., Laird J.H., Poirier J.T., Rudin C.M. Unravelling the biology of SCLC: implications for therapy. Nat. Rev. Clin. Oncol. 2017;14:549–561. doi: 10.1038/nrclinonc.2017.71. - DOI - PMC - PubMed
    1. Bernhardt E.B., Jalal S.I. In: Lung Cancer Cancer Treatment and Research. Reckamp K.L., editor. (Springer International Publishing); 2016. Small cell lung cancer; pp. 301–322. - DOI - PubMed
    1. Bray F., Ferlay J., Laversanne M., Brewster D.H., Gombe Mbalawa C., Kohler B., Piñeros M., Steliarova-Foucher E., Swaminathan R., Antoni S., et al. Cancer I ncidence in F ive C ontinents: Inclusion criteria, highlights from Volume X and the global status of cancer registration. Int. J. Cancer. 2015;137:2060–2071. doi: 10.1002/ijc.29670. - DOI - PubMed
    1. Siegel R.L., Miller K.D., Jemal A. Cancer statistics, 2016. CA. Cancer J. Clin. 2016;66:7–30. doi: 10.3322/caac.21332. - DOI - PubMed
    1. Horn L., Mansfield A.S., Szczęsna A., Havel L., Krzakowski M., Hochmair M.J., Huemer F., Losonczy G., Johnson M.L., Nishio M., et al. First-line atezolizumab plus chemotherapy in extensive-stage small-cell lung cancer. N. Engl. J. Med. 2018;379:2220–2229. doi: 10.1056/NEJMoa1809064. - DOI - PubMed

Publication types

MeSH terms