. 2025 Jun;66(6):354-365.
doi: 10.3349/ymj.2024.0227.

Dynamics of T Cell-Mediated Immune Signaling Network During Pathogenesis of Chronic Obstructive Pulmonary Disease

Affiliations

Dynamics of T Cell-Mediated Immune Signaling Network During Pathogenesis of Chronic Obstructive Pulmonary Disease

Chae Min Lee et al. Yonsei Med J. 2025 Jun.

Abstract

Purpose: Chronic obstructive pulmonary disease (COPD) is characterized by alveolar destruction and increased inflammation, leading to respiratory symptoms. This study aimed to identify the traits for COPD progression from mild to severe stages. Additionally, we explored the correlation between coronavirus disease-2019 (COVID-19) and COPD to uncover overlapping respiratory patterns.

Materials and methods: Bulk RNA sequencing was conducted on data from 43 healthy individuals and 39 COPD patients across one dataset (GSE239897) to distinguish COPD characteristics. Single-cell RNA analysis was then performed on samples from seven mild patients, seven moderate patients, and three severe patients from three datasets (GSE167295, GSE173896, and GSE227691) to analyze disease progression. Finally, single-nuclei RNA analysis was applied to data from seven healthy individuals and 20 COVID-19 patients from one dataset (GSE171524) to compare the two conditions.

Results: Bulk RNA sequencing revealed enhanced inflammatory pathways in COPD patients, indicating increased inflammation. Single-cell RNA sequencing showed a stronger inflammatory response from mild to moderate COPD with a decrease from moderate to severe stages. COVID-19 displayed similar biological patterns to moderate COPD, suggesting that stage-specific COPD analysis could enhance COVID-19 management.

Conclusion: The analysis found that immune responses increased from mild to moderate stages but declined in severe cases, marked by reduced pulmonary T cell activation. The overlap between moderate COPD and COVID-19 suggests shared therapeutic strategies, warranting further investigation.

Keywords: COVID-19; Chronic obstructive pulmonary disease; single-cell RNA sequencing.


Conflict of interest statement

The authors have no potential conflicts of interest to disclose.

Figures

Fig. 1
Fig. 1. COPD prominently exhibiting inflammation and T cell activation. (A) The experimental design for bulk RNA sequencing involved dataset from control subjects (n=43) and COPD patients (n=39). The dataset was acquired from GSE239897. (B) Enrichment plots depict the enrichment scores of the inflammatory response, interferon gamma response, and TNF-α signaling via NF-κB from the hallmark dataset. In all plots, COPD exhibits a higher score compared to control individuals. (C and D) Dot plot displaying the gene expression levels of control and COPD patient data. Both CXCL8 and IL6 gene expressions, associated with inflammation, are higher in COPD patients. (E) Dot plot illustrates the gene expression levels of control and COPD patient data. The expression of IFNG gene, associated with T cell activation, is elevated in COPD patients (*p<0.1, **p<0.01, ****p<0.0001). COPD, chronic obstructive pulmonary disease; NES, normalized enrichment score; FDR, false discovery rate; TNF-α, tumor necrosis factor-alpha; NF-κB, nuclear factor-kappa B.
Fig. 2
Fig. 2. A change in the trend of T cell behaviors as COPD progresses. (A) Schematic diagram depicts the workflow of single-cell RNA sequencing. Data from seven mild patients, seven moderate patients, and three severe patients were employed in the analysis. The datasets were obtained from GSE227691, GSE173896, and GSE167295. (B) UMAP plot displays 12 integrated clusters with 55154 cells. (C) Dot plot illustrates marker genes used for annotating the twelve clusters in (B) . The dot size corresponds to the percentage of cells expressing the marker, while the color scale indicates the average marker expression across all clusters in COPD patients in (A). (D) Bar graphs show the cell proportions for each patient, indicating the heterogeneous nature across all patients. (E) Bar graphs present the overall cell proportions when patient data is combined into mild, moderate, and severe categories. They show a decrease in the proportion of T cells from mild to moderate, followed by an increase towards severe. (F) Circle plots feature the cell-cell communication network between T cells and adjacent cell clusters at each stage of COPD. They demonstrate an increase in interactions from mild to moderate, but a decrease towards severe. COPD, chronic obstructive pulmonary disease; UMAP, Uniform Manifold Approximation and Projection; NK, natural killer cell; Macro, macrophage; Endo, endothelial cell; Pul1, pulmonary alveolar type I; Pul2, pulmonary alveolar type II; Fibro, fibroblast; Mast, mast cell; Ciliated, ciliated cell; Clara, clara cell; Peri, pericyte.
Fig. 3
Fig. 3. Changes in relationship with neighboring clusters as COPD progresses to severe. (A) Heatmap illustrates the variance in the number of interactions (left) and interaction strength (right) among distinct cell populations in mild and moderate patients. (B) Heatmap depicts the differential number of interactions (left) and interaction strength (right) in moderate and severe patients. (C) Bar graphs compare the information flow for each signaling pathway between mild and moderate patients. It highlights the differences in signal trends when T cells function as targets versus sources. This flow is defined as the sum of communication probabilities between T cells acting as targets (left) or sources (right) and surrounding cells. Pathways depicted in red exhibit significantly stronger values in the mild, while those in green show significantly stronger values in the moderate. Pathways marked in black denote non-significant p-values. (D) Bar graphs depict the relative information flow between T cells as targets (left) or sources (right) and adjacent cells in moderate and severe patients. Pathways represented in green signify significantly stronger values in the moderate stage, while those in blue signify stronger values in severe patients. Black indicates non-significant p-values. COPD, chronic obstructive pulmonary disease; NK, natural killer cell; Macro, macrophage; Endo, endothelial cell; Pul1, pulmonary alveolar type I; Pul2, pulmonary alveolar type II; Fibro, fibroblast; Mast, mast cell; Ciliated, ciliated cell; Clara, clara cell; Peri, pericyte.
Fig. 4
Fig. 4. Distinct pathway trends in T cells emerge as COPD advances. (A) Dot plot depicts the outcomes of GSEA based on GOBP in T cells of mild and moderate patients. The plot presents NES in descending order along with significant p-values. Notably, pathways primarily related to immune response are prominently represented at the top, highlighted with a red box. (B) Dot plots illustrate the average log2 fold change and -log10 adjusted p-values of top genes associated with high pathways identified in (A). The values were calculated during the identification of DEGs. Similarly to the top genes associated with increased pathways in moderate, they exhibit the most robust expression levels in moderate. (C) Dot plot represents the result of GSEA based on GOBP, comparing T cells from moderate and severe patients. In contrast to the findings in (A), pathways associated with decreased immune response in severe are observed to decrease, while pathways related to fibrosis show an increase. Pathways highlighted with a red box indicate those linked to decreased immune response, and pathways highlighted with a yellow box are related to fibrosis. (D) Dot plot displays the average log2 fold change and -log10 adjusted p-values of top genes related to pathways identified as significant in (C). The values were derived during the calculation of DEGs. Similarly, they also confirm the highest expression levels in severe patients. COPD, chronic obstructive pulmonary disease; GSEA, Gene Set Enrichment Analysis; GOBP, Gene Ontology Biological Processes; NES, normalized enrichment score; avg_log2FC, average log2 fold change; -log10 (adjust_pval), -log10 adjusted p-value.
Fig. 5
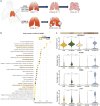
Fig. 5. Similar traits between moderate COPD and COVID-19. (A) Overview of analysis conducted using COVID-19 patient data. The COPD patient data remained consistent throughout, while the COVID-19 patient data was obtained from GSE171524, comprising seven control individuals and 20 COVID-19 patients. (B) Dot plot shows the GSEA results comparing COVID-19 patients and control individuals. Many pathways related to immune response were prominently identified in the top 30. Pathways highlighted with an orange box denote those associated with immune response. When compared to Fig. 4, similar trends are observed in the GSEA results of COPD moderate patients. (C) Violin plots illustrate the expression levels of top genes associated with immune-response related pathways significantly observed in (B). In COPD data, the highest expression is noted in moderate patient, while COVID-19 patients show a notable different expression compared to control individuals (****p <0.0001). COPD, chronic obstructive pulmonary disease; GOBP, Gene Ontology Biological Processes; GSEA, Gene Set Enrichment Analysis.

Similar articles

References

    1. Li X, Cao X, Guo M, Xie M, Liu X. Trends and risk factors of mortality and disability adjusted life years for chronic respiratory diseases from 1990 to 2017: systematic analysis for the global burden of disease study 2017. BMJ. 2020;368:m234. - PMC - PubMed
    1. Cho WK, Lee CG, Kim LK. COPD as a disease of immunosenescence. Yonsei Med J. 2019;60:407–413. - PMC - PubMed
    1. Seo JY, Hwang YI, Mun SY, Kim JH, Kim JH, Park SH, et al. Awareness of COPD in a high risk Korean population. Yonsei Med J. 2015;56:362–367. - PMC - PubMed
    1. Li HY, Gao TY, Fang W, Xian-Yu CY, Deng NJ, Zhang C, et al. Global, regional and national burden of chronic obstructive pulmonary disease over a 30-year period: estimates from the 1990 to 2019 global burden of disease study. Respirology. 2023;28:29–36. - PMC - PubMed
    1. Melms JC, Biermann J, Huang H, Wang Y, Nair A, Tagore S, et al. A molecular single-cell lung atlas of lethal COVID-19. Nature. 2021;595:114–119. - PMC - PubMed