. 2025 May 26;24(1):151.
doi: 10.1186/s12943-025-02350-6.

GP73-dependent regulation of exosome biogenesis promotes colorectal cancer liver metastasis

Affiliations

GP73-dependent regulation of exosome biogenesis promotes colorectal cancer liver metastasis

Linfei Huang et al. Mol Cancer. .

Abstract

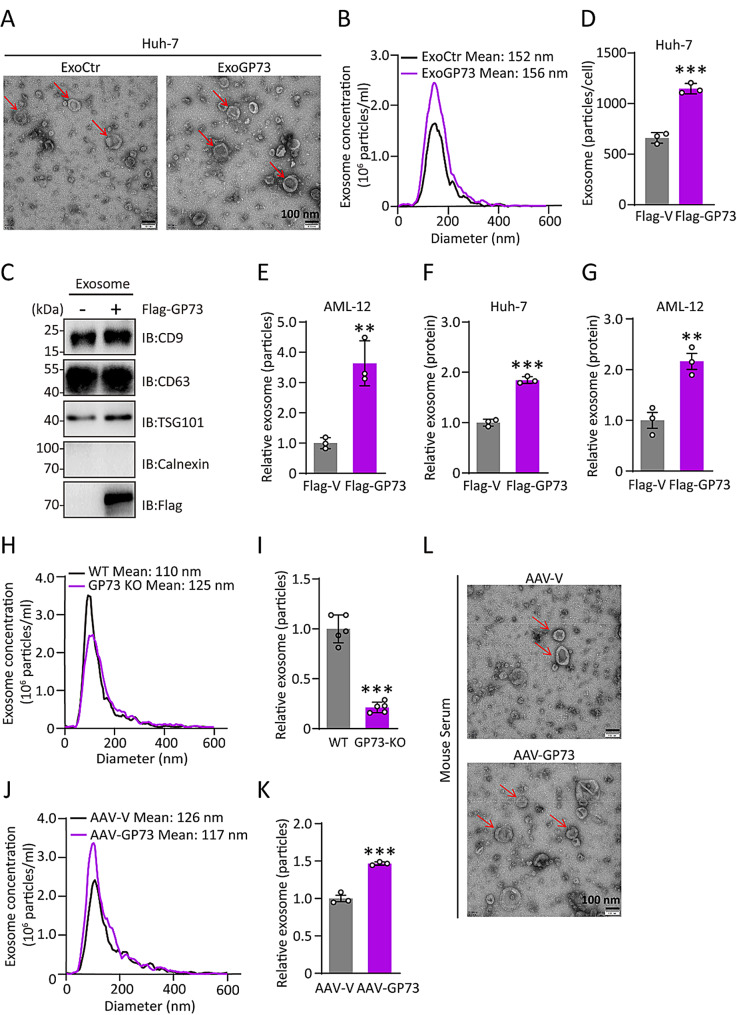
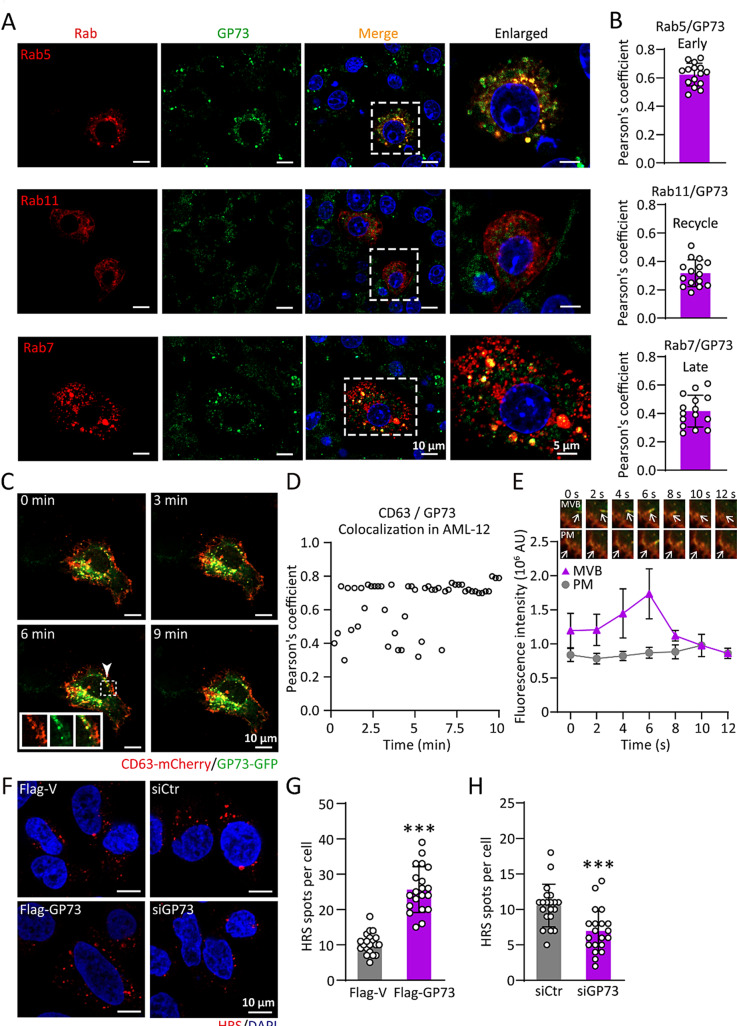
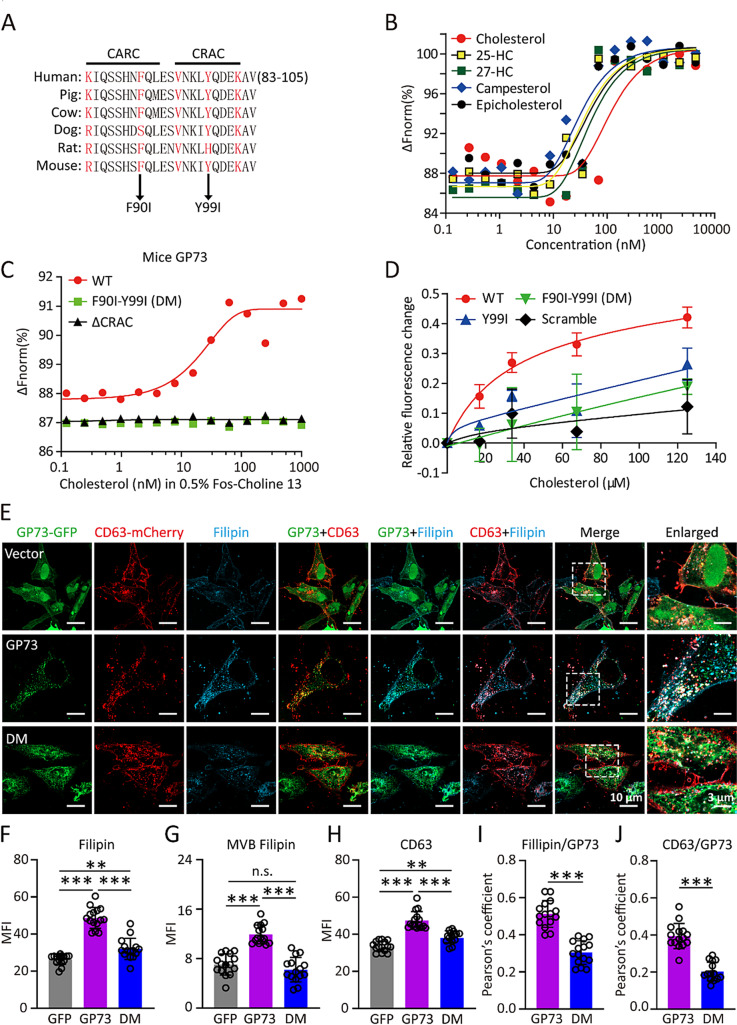
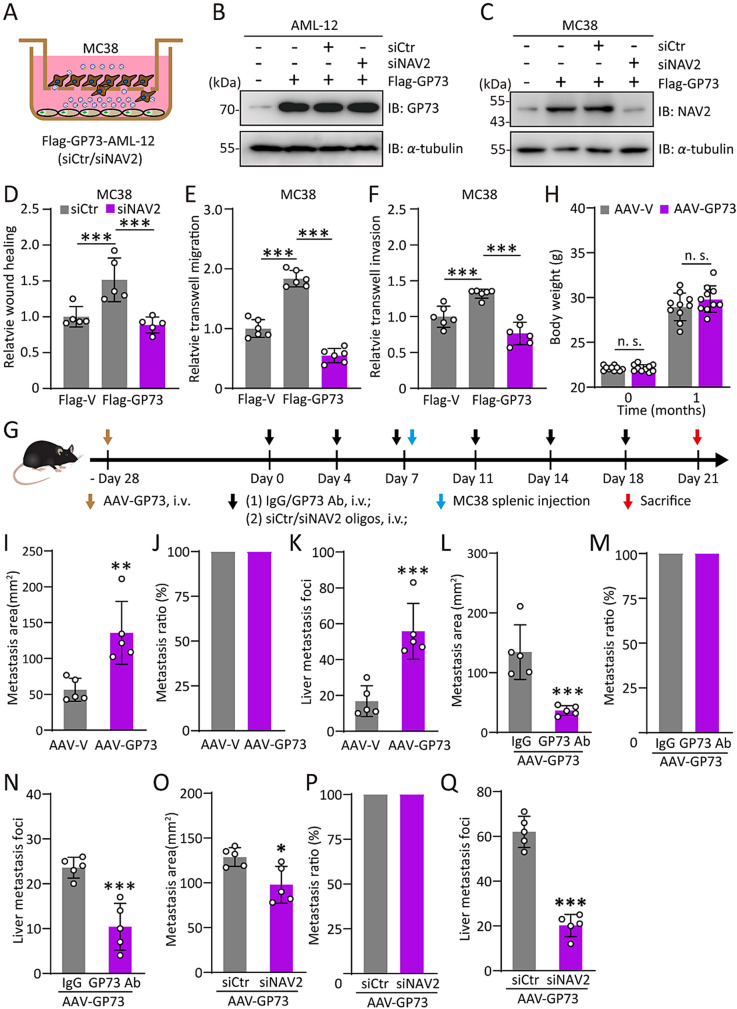
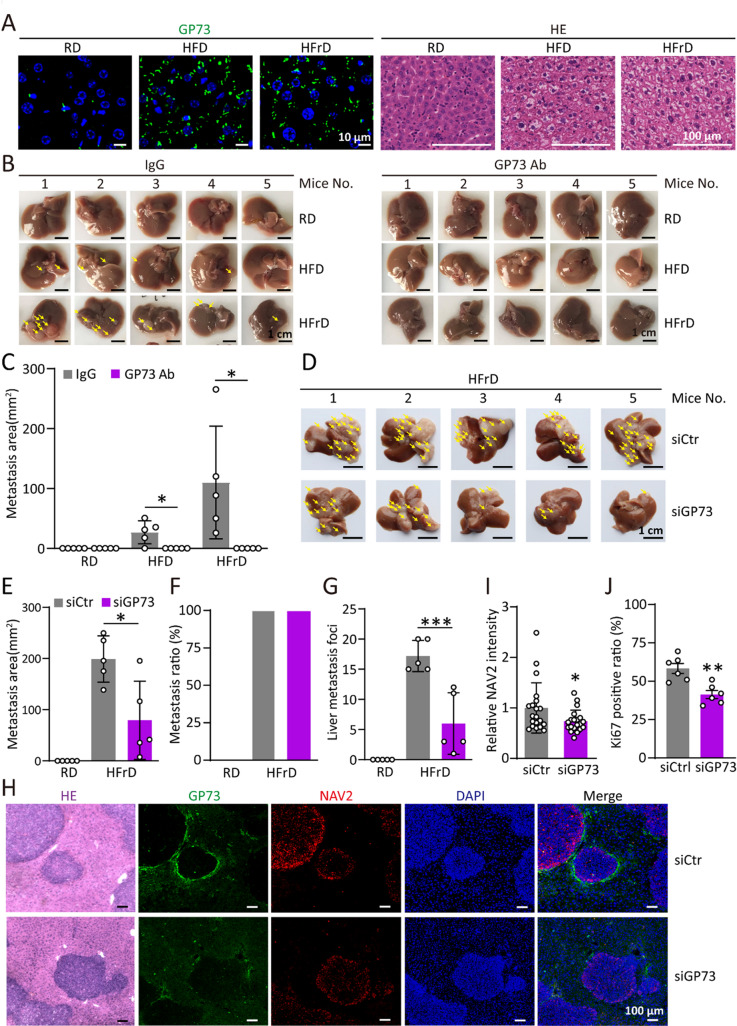
Colorectal cancer (CRC) liver metastasis is the main cause of cancer-related mortality. How liver influences intercellular communication to support CRC liver metastasis remains unknown. Herein, we link GP73, whose chronic upregulation in hepatocytes triggers non-obese metabolic-dysfunction associated steatotic liver disease (MASLD) in mice, with exosome biogenesis and CRC liver metastasis. Mice with high liver GP73 expression exhibited increased CRC liver metastasis in an exosome-dependent manner. GP73 modulated the cholesterol contents in endosomal compartments to promote exosome production. Quantitative proteomics revealed GP73 reshaped hepatocyte exosomal proteome and produced NAV2-rich exosomes. Clinically, serum GP73 levels positively correlated with exosomal NAV2 levels in CRC patients with liver metastasis. Knockdown of liver NAV2 suppressed enhanced CRC liver metastasis in GP73-induced non-obese mice, and GP73 blockade mitigated the increased CRC liver metastasis in obese mice fed by high-fat diet or high-fructose diet. Our findings suggest GP73 blockade as a potential therapeutic strategy for mitigating CRC liver metastasis.

GP73 closely correlated with exosome biogenesis and CRC liver metastasis, and GP73 blockade may merit exploration as a potential therapeutic strategy for mitigating CRC liver metastasis.

Keywords: Colorectal cancer; Exosome; Golgi protein 73; Metastasis.


Conflict of interest statement

Declarations. Ethics approval and consent to participate: The use of patient samples in this study was approved by the Ethics Committee of Guangxi Medical University Cancer Hospital (LW2023060). All animal experiments were conducted at the AMMS Animal Center (Beijing, China) and were reviewed and approved by the Institutional Animal Care and Use Committee (IACUC-DWZX-2023-022). Consent for publication: All authors read and approved the final manuscript. Notes: No author disclosures were reported. Competing interests: The authors declare no competing interests.

Figures

Fig. 1
Fig. 1
Liver GP73 expression is pathologically elevated in CRC patients with liver metastasis. (A) Serum GP73 levels in healthy controls (Healthy, n = 50), CRC patients without liver metastasis (CRNLM, n = 53), and CRC patients with liver metastasis (CRLM, n = 34). (B) Representative immunofluorescence images of GP73 and Albumin staining in livers from healthy controls (normal liver tissue, NLT, n = 4) and CRLM (n = 8). Green, GP73 staining; red, Albumin staining; blue, nuclear DAPI staining; scale bars, 20 μm. (C) Relative GP73 staining intensity in samples from (B); the average GP73 intensity of healthy controls was set to 1. (D-E) Representative images of metastatic liver from AAV-V- or AAV-GP73-injected mice inoculated with MC38 cells via intrasplenic injection (D, n = 5) and quantification of metastatic tumor size (E). (F-G) Representative images of metastatic liver from AAV-GP73-injected mice inoculated with MC38 cells via intrasplenic injection in the presence of GW4869 (F, n = 5) and quantification of metastatic tumor size (G). The arrows show liver metastastic foci. All images were representative of at least three biological replicates. All quantitative data were presented as the mean ± SD. Statistical significance was determined using one-way ANOVA with the Bonferroni correction (A, C) or two-tailed Student’s t test (E, G)
Fig. 2
Fig. 2
GP73 promotes exosome production. (A) Transmission electron microscopy of purified exosomes derived from Huh-7 cells transfected with Flag-vector (ExoCtr) or Flag-GP73 (ExoGP73). (B) Representative NTA of ExoCtr and ExoGP73. The x-axis shows the diameter of the vesicles, and the y-axis shows the concentration (106 particles/mL) of the vesicles. (C) Immunoblotting of exosome markers (CD9, CD63, and TSG101) and negative marker of exosomes (Calnexin) in the purified Huh-7 cell-derived ExoCtr and ExoGP73. Molecular weights (in kDa) are shown to the left. (D-E) Exosome particles released from equal numbers of Flag-V or Flag-GP73-transfected Huh-7 cells (D) and AML-12 cells (E). The abundances of particles in exosomes released from Flag-V transfected cells were normalized to 1 (n = 3). (F-G) Exosomal protein released from equal numbers of Flag-V- or Flag-GP73-transfected Huh-7 cells (F) and AML-12 cells (G). The abundances of proteins in exosomes released from Flag-V transfected cells were normalized to 1 (n = 3). (H-K) Representative NTA of purified serum exosomes and exosome particles isolated from 0.5 mL of serum derived from WT and GP73-KO mice (H, I) (n = 5), and from AAV-V- or AAV-GP73-injected mice (J, K) (n = 3). (L) Transmission electron microscopy of purified serum exosomes from AAV-V- or AAV-GP73-injected mice. Cell-based studies were performed independently at least three times with comparable results. All quantitative data were presented as the mean ± SD. All images were representative of at least three biological replicates. Statistical significance was determined using two-tailed Student’s t test (D, E, F, G, I, K)
Fig. 3
Fig. 3
GP73 overlaps with endosomal compartments and increases MVB numbers. (A-B) Confocal micrographs of GP73 (green) and markers of early (Rab5, red), recycling (Rab11, red), and late (RAB7, red) endosomes in AML-12 cells transfected with Flag-GP73 (A) and quantification of the Pearson’s correlation coefficient for co-localization between GP73 and the endosome compartment (n = 15 cell fields; B). The scale bars represent 10 μm (whole image) and 5 μm (enlarged). (C-E) Confocal micrographs (C) and quantitative analysis (D-E) from live-cell imaging of AML-12 cells transfected with Flag-V or Flag-GP73. The white arrows show peripheral compartments where CD63 (red) and GP73 (green) co-localize; scale bar, 10 μm. Quantification of three independent experiments showing the range of Pearson’s co-localization coefficient between GP73 and CD63 (D) and the mean ± SD fluorescence intensity inside the cell and in the plasma membrane (PM) (E) were automatically quantified (> 5 cells, 8 fields). (F-H) Confocal micrographs (F) and quantification of the MVB marker HRS in AML-12 cells transfected with Flag-V or Flag-GP73 (G) or transfected with control siRNA nucleotide oligoes (siCtr) or GP73 siRNA nucleotide oligoes (siGP73; H) (n = 20 cell fields). Each dot represents the number of HRS+ particles from individual cells. Red, HRS staining; blue, nuclear DAPI staining; scale bar, 10 μm. Cell-based studies were performed independently at least three times with comparable results. All images were representative of three biological replicates. All quantitative data were presented as the mean ± SD. Statistical significance was determined using two-tailed Student’s t test (G, H)
Fig. 4
Fig. 4
GP73 binds to cholesterol and modulates the cholesterol content in MVBs. (A) Schematic illustration of the cholesterol-binding motif in GP73 in different species. Crucial amino acid residues in the CARC motif and CRAC motif are highlighted in red. (B) Analysis of interactions between GP73 and cholesterol, 25-HC, 27-HC, campesterol, and epicholesterol by MST. The data were derived from the effects of the indicated ligands on the fluorescence decay of fluorescently labeled GP73. (C) Analysis of interactions between cholesterol and mouse GP73 (WT), the GP73 CRAC domain deletion mutant (∆CRAC) and the CARC Phe90/CRAC Tyr99 double mutant of mouse GP73 (F90I-Y99I, DM) by MST. The data were derived from the effects of the sterols on the fluorescence decay of fluorescently labeled proteins. (D) Titration curves showing changes in the intrinsic fluorescence of WT, Y99I, F90I-Y99I (DM), or scrambled peptides (5 µM) in the presence of increasing concentrations of cholesterol. (E-J) Confocal micrographs of CD63 and filipin staining in cells transfected with Flag-V, Flag-GP73, or Flag-DM (E) and quantitative mean fluorescence intensity (MFI) analysis of the filipin (F), filipin in MVBs (G), CD63 (H), and Pearson correlation coefficient for co-localization between filipin and GP73 (I) or GP73 and CD63 (J) (n = 16). Green, GP73-GFP; red, CD63-mCherry; cyan, filipin staining. A enlarged view of the boxed region is also shown. The scale bars represent 10 μm (whole image) and 3 μm (enlarged). Cell-based studies were performed independently at least three times with comparable results. All images were representative of three biological replicates. All quantitative data were presented as the mean ± SD. Statistical significance was determined using one-way ANOVA with the Bonferroni correction (F, G, H) or two-tailed Student’s t test (I, J)
Fig. 5
Fig. 5
Exosomes derived from GP73-high hepatocytes exert a prometastatic effect. (A) Schematic diagram of the Flag-V-, Flag-GP73- or Flag-DM-transfected cell co-culture system (upper) and representative images from transwell migration assay (lower). Scale bar, 100 μm. (B-D) Quantification of the transwell migration assay (B, n = 8), the wound healing assay (C, n = 6) and the Matrigel-transwell invasion assay (D, n = 5) of the migrated MC38 cells in the co-culture system. The values in Flag-V-transfected AML-12 cells were set to 1. (E) Immunoblotting of exosome markers in liver lysates (10 µg of total protein) and purified in vivo-derived liver exosomes (10 µg of total protein). Molecular weights are shown to the left. (F) Representative NTA of purified liver exosomes from AAV-V- or AAV-GP73-injected mice. The x-axis shows the diameter of the vesicles, and the y-axis shows the concentration (106 particles/mL) of the vesicles. (G-I) Quantitative analysis of data from the wound healing assay (G, n = 5), the transwell migration assay (H, n = 6), and the Matrigel-transwell invasion assay (I, n = 6) in migrated MC38 cells treated with ExoCtr or ExoGP73. The values in ExoCtr-treated MC38 cells were set to 1. (J) Schematic of the in vivo metastasis assay in mice treated with ExoCtr or ExoGP73 (2 × 108 particles/injection) twice a week (n = 5 mice per group). (K-N) Representative images of metastatic liver tissue from mice inoculated with MC38 cells after treatment with ExoCtr or ExoGP73 (n = 5 mice per group) (K) and quantification of metastatic tumor ratio (L), size (M), and number (N). The arrows show liver metastastic foci. Cell-based studies were performed independently at least three times with comparable results. All images were representative of at least three biological replicates. All quantitative data were presented as the mean ± SD. Statistical significance was determined using one-way ANOVA with the Bonferroni correction (B, C) or two-tailed Student’s t test (D, G, H, I, M, N)
Fig. 6
Fig. 6
GP73 mediates the production of NAV2-rich exosomes. (A) Volcano plot of protein abundances in exosomes derived from Flag-V- or Flag-GP73-transfected Huh-7 cells using LC-MS/MS-based proteomics. Significantly downregulated genes are shown in blue, and significantly upregulated genes are shown in red. The black vertical lines highlight fold changes (FCs) of -1.5 and 1.5, while the black horizontal line indicates a P value of 0.05. (B) Pathways enriched in ExoGP73 according to GO term analysis at GO cellular component (CC) level. The bar plot shows significantly percentage of dysregulated proteins in each cellular component. (C) Pathways enriched in proteins in ExoGP73 according to GO term analysis at the GO biological process (BP) level. The bar plot shows significantly dysregulated pathways, and Fisher’s exact test P values are shown on the x-axis. (D) Pathways most significantly enriched in proteins in ExoGP73, according to KEGG pathway analysis. The enriched terms are shown on the y-axis, and the Fisher’s exact test P values (log transformed) indicating the significance of enrichment are shown on the x-axis. The degree of KEGG pathway enrichment was quantified by the enrichment factor (rich factor), the P value and the number of genes enriched in the pathway. (E) Immunoblotting of NAV2, exosome markers (CD9) and negative marker of exosomes (Calnexin) in whole cell lysates (WCL) and in purified exosomes derived from Huh-7 cells transfected with Flag-V or Flag-GP73. Molecular weights (in kDa) are shown to the left. Anti-NAV2 antibody (Signalway Antibody) was used for the target of NAV2. (F-G) Immunoblotting of NAV2, exosome markers (CD81), and negative marker of exosomes (Calnexin) in serum exosomes (F) and liver lysates and purified liver exosomes from AAV-V- or AAV-GP73-injected mice (G) Molecular weights (in kDa) are shown to the left. Anti-NAV2 antibody (Affinity Biosciences) was used for the target of NAV2. (H) Pearson’s correlation coefficients of the correlations between serum exosome NAV2 levels and GP73 levels in samples from CRLM (n = 6). Cell-based studies were performed independently at least three times with comparable results. All images were representative of three biological replicates
Fig. 7
Fig. 7
Knockdown of liver NAV2 suppressed CRC liver metastasis in GP73-induced non-obese mice. (A) Schematic diagram of the co-culture system. Upper compartment: MC38 cells. Bottom compartment: Flag-V or Flag-GP73 AML-12 cells transfected with siCtr or siNAV2. (B-C) Immunoblotting analysis of NAV2 and GP73 protein in AML-12 cells (B) and MC38 cells (C) from the co-culture system. α-Tubulin was used as the loading control. Molecular weights (in kDa) are shown to the left. Anti-NAV2 antibody (Signalway Antibody) was used for the target of NAV2. (D-F) Quantification of the wound healing assay (D, n = 5), the transwell migration assay (E, n = 6), and Matrigel-transwell invasion assay (F, n = 6) data for migrated MC38 cells co-cultured with Flag-V or Flag-GP73 cells transfected with siCtr or siNAV2. The values in Flag-V-AML-12 cells transfected with siCtr were set to 1. (G) Schematic of the in vivo metastasis assay in AAV-V- and AAV-GP73-treated mice injected with GP73 Ab or siNAV2 RNAi nucleotide oligoes twice a week beginning at 4 weeks after adenovirus injection (n = 5 mice per group). (H) Body weights of AAV-V- and AAV-GP73-treated mice (n = 10 mice per group). (I-K) Quantification of metastatic tumor size (I), ratio (J), and number (K) of AAV-V- and AAV-GP73-injected mice. (L-N) Quantification of metastatic tumor size (L), ratio (M), and number (N) of AAV-GP73-injected mice in the presence of mouse IgG or anti-GP73 antibody (15 mg/kg mouse IgG or GP73 Ab). (O-Q) Quantification of metastatic tumor size (O), ratio (P) and number (Q) of AAV-GP73-injected mice injected with siCtr or siNAV2 RNAi nucleotide oligoes (60 nmol/kg). Cell-based studies were performed independently at least three times with comparable results. All images are representative of three biological replicates. All quantitative data are presented as the mean ± SD. Statistical significance was determined using one-way ANOVA with the Bonferroni correction (D, E, F) or two-tailed Student’s t test (H, I, K, L, N, O, Q)
Fig. 8
Fig. 8
GP73 blockade inhibited the increase in CRC liver metastasis triggered by HFD or HFrD feeding. (A) Representative images of GP73 staining (A; scale bars, 10 μm) or HE staining (scale bars, 100 μm) in livers from mice fed on a RD, HFD, or HFrD for 4 months (n = 5 mice per group). Green, GP73 staining; blue, nuclear DAPI staining. (B-C) Representative images of metastatic liver from mice fed on a RD, HFD or HFrD for 4 months and inoculated with MC38 cells via intrasplenic injection after the treatment of mouse IgG or GP73 Ab (B, n = 5 mice per group; 15 mg/kg) and quantification of metastatic tumor size (C). (D-G) Representative histopathological images of metastatic liver tissue from siCtr- or siGP73-treated mice fed with HFrD for 6 months and inoculated with MC38 cells via intrasplenic injection (D, n = 5 mice per group) and quantification of metastatic tumor size (E), ratio (F), and numbers (G). (H-J) Representative immunofluorescence staining images of metastatic tissue from siCtr- or siGP73-treated mice fed with HFrD (H) and quantification of the relative NAV2 (I) and Ki67 (J) staining for each group, based on 20 and 6 independent fields, respectively. Green, GP73 staining; red, NAV2 staining; blue, DAPI staining. Scale bars, 100 μm. The arrows show liver metastastic foci. All images are representative of three biological replicates. Anti-NAV2 antibody (Affinity Biosicences) was used for the target of NAV2. All quantitative data are presented as the mean ± SD. Statistical significance was determined using two-tailed Student’s t test (C, E, G, I, J)

References

    1. Xi Y, Xu P. Global colorectal cancer burden in 2020 and projections to 2040. Transl Oncol. 2021;14:101174. 10.1016/j.tranon.2021.101174. - PMC - PubMed
    1. Rawla P, Sunkara T, Barsouk A. Epidemiology of colorectal cancer: incidence, mortality, survival, and risk factors. Prz Gastroenterol. 2019;14:89–103. 10.5114/pg.2018.81072. - PMC - PubMed
    1. Hossain MS, et al. Colorectal cancer: A review of carcinogenesis, global epidemiology, current challenges, risk factors, preventive and treatment strategies. Cancers (Basel). 2022;14. 10.3390/cancers14071732. - PMC - PubMed
    1. Aziz H, Ahmed Z, Lee Y, Drumm G, Saif MW. A comprehensive review of management of colorectal liver Mets in the current era. Cancer Med J. 2022;5:46–57. - PMC - PubMed
    1. Zhou H, et al. Colorectal liver metastasis: molecular mechanism and interventional therapy. Signal Transduct Target Ther. 2022;7:70. 10.1038/s41392-022-00922-2. - PMC - PubMed

LinkOut - more resources