

Exploring how economic level drives urban flood risk
- PMID: 40414900
- PMCID: PMC12104414
- DOI: 10.1038/s41467-025-60267-6
Exploring how economic level drives urban flood risk
Abstract
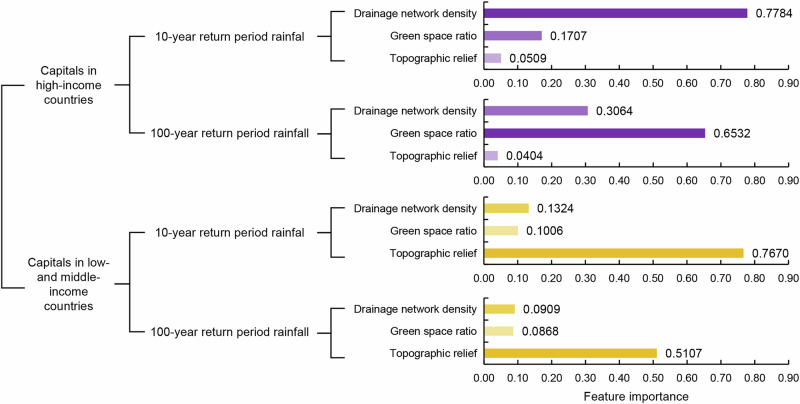
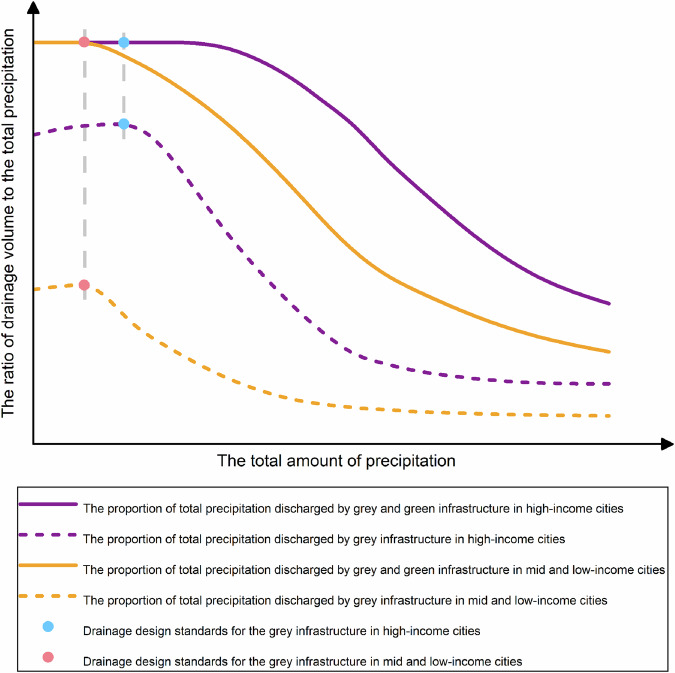
In recent years, measures proposed to address urban flooding caused by extreme rainfall often demand substantial investment, restricting their broad implementation. This study quantitatively assessed the inundation situations of 138 capital cities under both normal and extreme rainfall conditions. Using machine learning techniques, we found that grey infrastructure-closely commensurate with a city's economic development-dominates flood reduction during normal rainfall events. However, during extreme precipitation, as rainfall intensity rises, the marginal effectiveness of grey infrastructure declines markedly. In contrast, green infrastructure and topography-less commensurate with economic development-play increasingly critical roles in mitigating urban flooding. These findings suggest that economic development has a limited impact on urban flooding during extreme rainfall events. Rationally utilizing topography and enhancing green spaces provides a cost-effective nature-based solution, which is particularly important for urban planning in low- and middle-income countries undergoing rapid urbanization.
© 2025. The Author(s).
Conflict of interest statement
Competing interests: The authors declare no competing interests.
Figures


Similar articles
-
Assessment of urban underground spaces inundation during extreme rainfall events.Water Sci Technol. 2024 Jun;89(11):2851-2866. doi: 10.2166/wst.2024.165. Epub 2024 May 23. Water Sci Technol. 2024. PMID: 38877617
-
Study on the response analysis of LID hydrological process to rainfall pattern based on framework for dynamic simulation of urban floods.J Environ Manage. 2024 Feb;351:119953. doi: 10.1016/j.jenvman.2023.119953. Epub 2024 Jan 5. J Environ Manage. 2024. PMID: 38181681
-
Flood inundation assessment for the Hanoi Central Area, Vietnam under historical and extreme rainfall conditions.Sci Rep. 2018 Aug 22;8(1):12623. doi: 10.1038/s41598-018-30024-5. Sci Rep. 2018. PMID: 30135476 Free PMC article.
-
Urban green spaces and flood disaster management: toward sustainable urban design.Front Public Health. 2025 Apr 11;13:1583978. doi: 10.3389/fpubh.2025.1583978. eCollection 2025. Front Public Health. 2025. PMID: 40290497 Free PMC article. Review.
-
A systematic review of the human health and social well-being outcomes of green infrastructure for stormwater and flood management.J Environ Manage. 2019 Sep 15;246:868-880. doi: 10.1016/j.jenvman.2019.05.028. Epub 2019 Jun 25. J Environ Manage. 2019. PMID: 31252249
References
-
- Merz, B. et al. Causes, impacts and patterns of disastrous river floods. Nat. Rev. Earth Environ.2, 592–609 (2021).
-
- Dottori, F. et al. Increased human and economic losses from river flooding with anthropogenic warming. Nat. Clim. Change8, 781–786 (2018).
-
- Rentschler, J. et al. Global evidence of rapid urban growth in flood zones since 1985. Nature622, 87–92 (2023). - PubMed
-
- Jiang, R. et al. Substantial increase in future fluvial flood risk projected in China’s major urban agglomerations. Commun. Earth Environ.4, 389 (2023).
Grants and funding
LinkOut - more resources
Full Text Sources
