

A data-centric and interpretable EEG framework for depression severity grading using SHAP-based insights
- PMID: 40414904
- PMCID: PMC12103758
- DOI: 10.1186/s12984-025-01645-5
A data-centric and interpretable EEG framework for depression severity grading using SHAP-based insights
Abstract
Background: Major Depressive Disorder is a leading cause of disability worldwide. An accurate assessment of depression severity is critical for diagnosis, treatment planning, and monitoring, yet current clinical tools are largely subjective, relying on self-report and clinician judgment via traditional assessment scales. EEG has emerged as a promising, non-invasive modality for capturing neural correlates of depression. However, most EEG-based machine learning diagnostic studies focus on boosting classification accuracy through complex algorithms and small, homogenous datasets. These black-box approaches often yield results that are difficult to interpret and poorly generalizable, making clinical translation impractical. Therefore there remains a critical need for models that are not only accurate but also transparent, robust, and grounded in the physiological properties of the data itself.
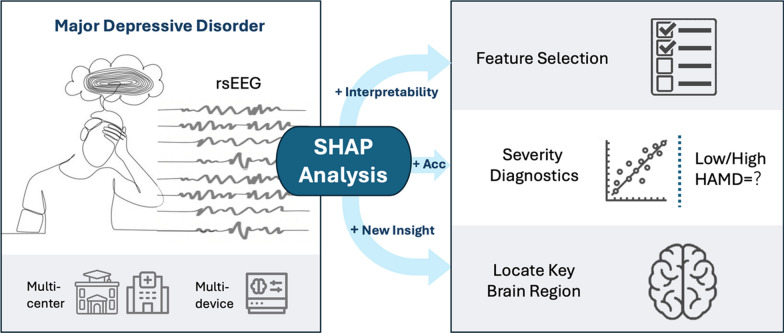
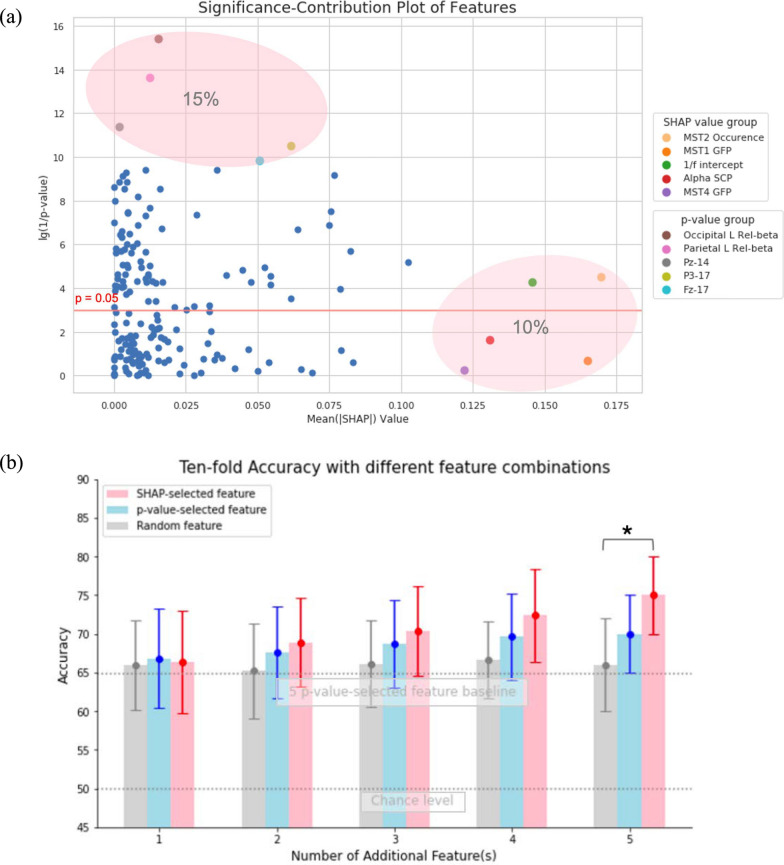
Methods: We proposed a data-centric, interpretable framework for EEG-based depression severity grading. A hybrid feature selection method was used, combining p-value and SHapley Additive exPlanations (SHAP) methods to select features that are both independently significant and jointly informative. The system was trained and evaluated on a large-scale, multi-site resting-state EEG dataset, using random forest for both classification and regression tasks. The SHAP method, an explainable artificial intelligence technique, is also used post-hoc to infer the key electrophysiological features and key brain regions associated with MDD mechanism to further increase interpretability.
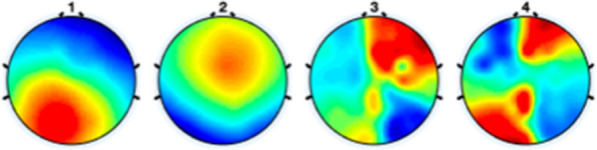
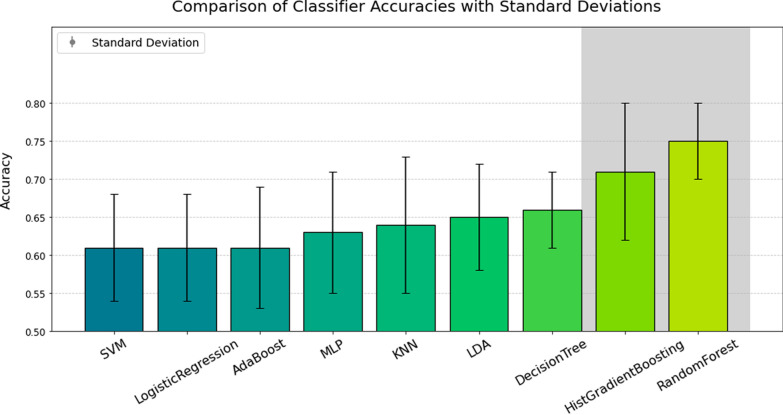
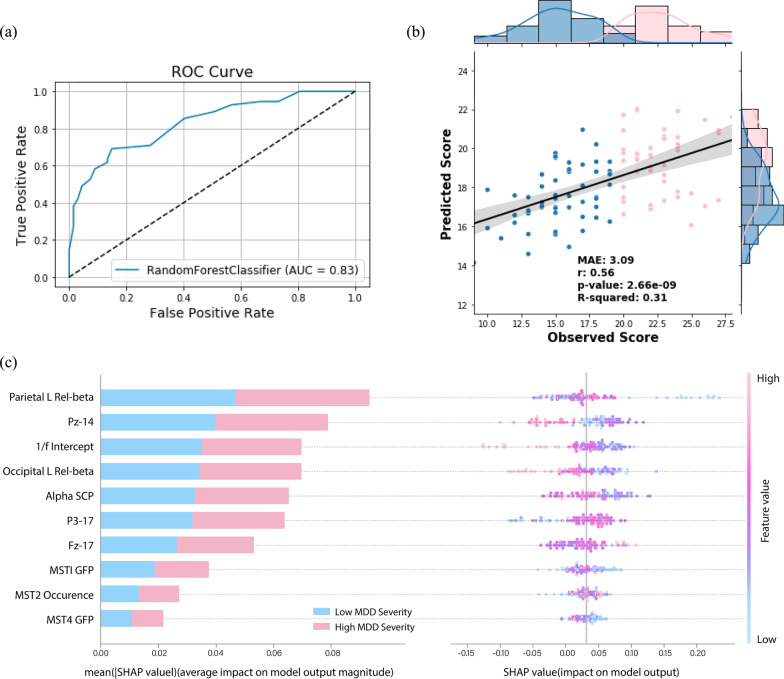
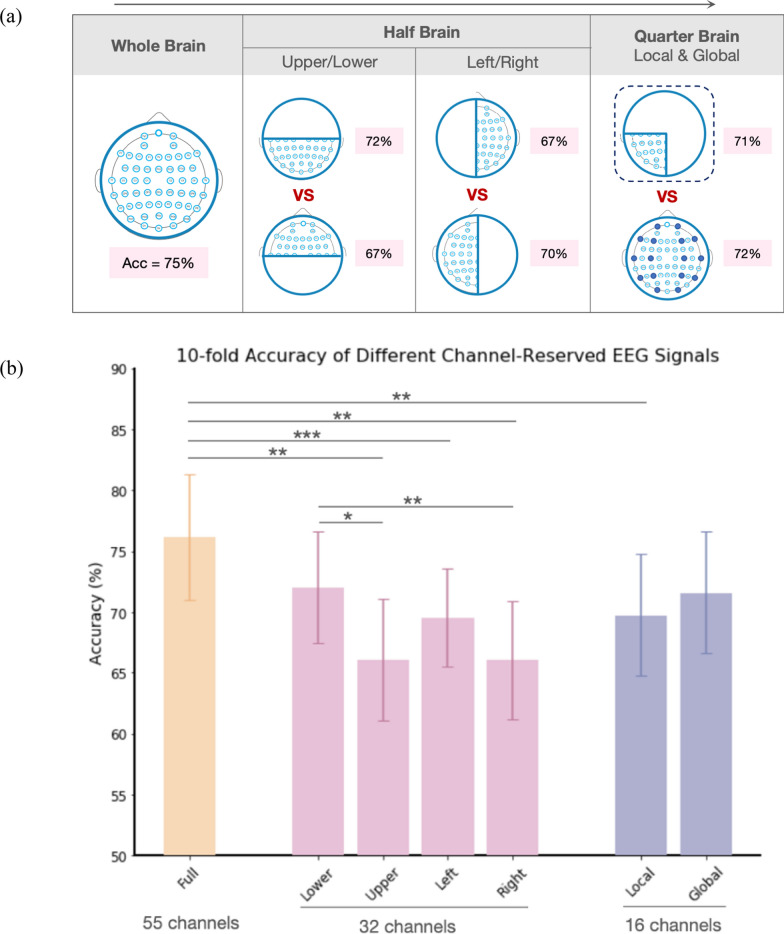
Results: The proposed system achieved 74.5% (95% CI [70.97%, 78.80%], p < 0.001) ten-fold classification accuracy and a correlation coefficient of 0.56 (95% CI [0.407, 0.683], p < 0.001) for severity estimation. SHAP analysis identified consistent, clinically meaningful EEG features, particularly in the left parietal-occipital lobe. Through in-depth SHAP value analysis, we identified critical disease-related brain areas in the left occipital and parietal lobes, along with key features including relative beta power in the left parietal lobe, time-domain features at the parietal midline, 1/f intercept, left occipital relative beta power, and global brain alpha energy.
Conclusion: This study proposes a data-centric, interpretable depression grading system built on large-scale, multi-center EEG data, using simple models and hybrid feature selection to emphasize explainability, generalizability and data fidelity. By shifting the focus from algorithmic complexity to data transparency and feature-level insight, the model offers a practical and trustworthy path toward real-world mental health assessment.
Keywords: Depression; EEG; Feature selection; Interpretable; Neurophysiological biomarkers; Resting state; SHAP.
© 2025. The Author(s).
Conflict of interest statement
Declarations. Ethics approval and consent to participate: Not applicable. The human data used in this study was acquired from a public dataset, where ethical consent is believed to be a part of the original study. Consent for publication: Not applicable. Same reason as above. Competing interests: The authors declare no competing interests.
Figures
Similar articles
-
An explainable and interpretable model for attention deficit hyperactivity disorder in children using EEG signals.Comput Biol Med. 2023 Mar;155:106676. doi: 10.1016/j.compbiomed.2023.106676. Epub 2023 Feb 18. Comput Biol Med. 2023. PMID: 36827785
-
EEG based functional connectivity in resting and emotional states may identify major depressive disorder using machine learning.Clin Neurophysiol. 2024 Aug;164:130-137. doi: 10.1016/j.clinph.2024.05.017. Epub 2024 Jun 1. Clin Neurophysiol. 2024. PMID: 38870669
-
XGBoost-SHAP-based interpretable diagnostic framework for alzheimer's disease.BMC Med Inform Decis Mak. 2023 Jul 25;23(1):137. doi: 10.1186/s12911-023-02238-9. BMC Med Inform Decis Mak. 2023. PMID: 37491248 Free PMC article.
-
Resting-State Electroencephalogram Depression Diagnosis Based on Traditional Machine Learning and Deep Learning: A Comparative Analysis.Sensors (Basel). 2024 Oct 23;24(21):6815. doi: 10.3390/s24216815. Sensors (Basel). 2024. PMID: 39517712 Free PMC article. Review.
-
Depression diagnosis: EEG-based cognitive biomarkers and machine learning.Behav Brain Res. 2025 Feb 26;478:115325. doi: 10.1016/j.bbr.2024.115325. Epub 2024 Nov 6. Behav Brain Res. 2025. PMID: 39515528 Review.
References
-
- Institute of Health Metrics and Evaluation. Global Health Data Exchange (GHDx). https://vizhub.healthdata.org/gbd-results/. Accessed 4 Mar 2023.
-
- Beck AT, Ward CH, Mendelson M, Mock J, Erbaugh J. An inventory for measuring depression. Arch Gen Psychiatry. 1961;4(6):561–71. - PubMed
-
- Otte C, Gold SM, Penninx BW, Pariante CM, Etkin A, Fava M, et al. Major depressive disorder. Nat Rev Dis Primers. 2016;2:16065. - PubMed
-
- Zimmerman M, Martinez JH, Young D, Chelminski I, Dalrymple K. Severity classification on the Hamilton Depression Rating Scale. J Affect Disord. 2013;150(2):384–8. - PubMed
MeSH terms
Grants and funding
LinkOut - more resources
Full Text Sources
Medical
