

The non-linear association between remnant cholesterol/high-density lipoprotein cholesterol ratio and diabetic retinopathy: a cross-sectional study in type 2 diabetic patients
- PMID: 40414909
- PMCID: PMC12105402
- DOI: 10.1186/s13098-025-01719-3
The non-linear association between remnant cholesterol/high-density lipoprotein cholesterol ratio and diabetic retinopathy: a cross-sectional study in type 2 diabetic patients
Abstract
Objective: The strong correlation between the ratio of residual cholesterol to high-density lipoprotein cholesterol (RC/HDL-c) and major cardiovascular events has been extensively studied. However, the role of this ratio in diabetic retinopathy (DR) has not been investigated. Hence, this present study aims to examine the association between the RC/HDL-c ratio and DR in patients diagnosed with type 2 diabetes mellitus (T2DM).
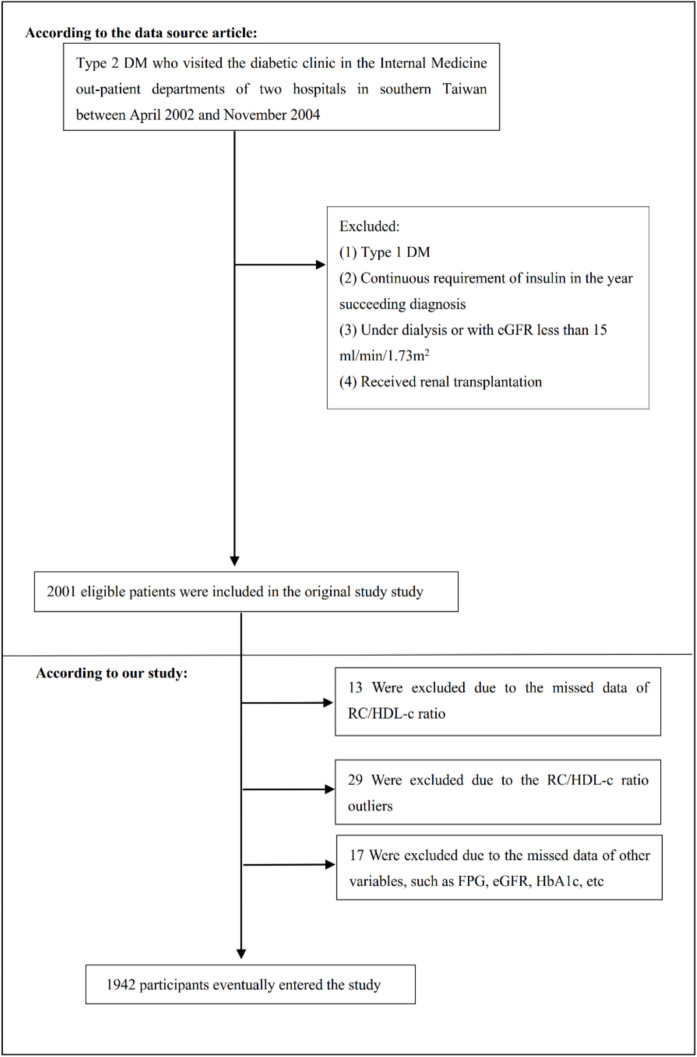
Methods: This study conducted a cross-sectional analysis involving a total of 1942 patients diagnosed with T2DM in two Taiwanese hospitals, spanning from April 2002 to November 2004. The primary objective was to explore the independent association between the RC/HDL-c ratio and the presence of DR, as well as proliferative diabetic retinopathy (PDR), using a binary logistic regression model. To accurately determine the shape of the association between these variables, we utilized a generalized additive model (GAM) and employed smooth curve fitting techniques. The data was downloaded from the website: https://journals.plos.org/plosone .
Results: Our study comprised participants with an average age of 64.06 ± 11.32 years, with males accounting for 43.05% of the total. Among the patients, 35.12% were found to have DR, while PDR was present in 18.23% of cases. The average RC/HDL-c ratio was calculated as 0.67 ± 0.39. Utilizing a fully adjusted logistic regression model, we investigated the potential association between the TC/HDL-c ratio and both DR and PDR. However, no statistically significant association was observed (DR: OR 1.060; 95% CI 0.707, 1.588; PDR: OR 1.258; 95% CI 0.773, 2.047). Interestingly, we did discover a non-linear association between the RC/HDL-c ratio and DR. Employing a two-piece logistic regression model and a recursive algorithm, we identified an inflection point at 0.460. When the RC/HDL-c ratio fell below 0.460, each 1-unit increase in the ratio was associated with an 11.8-fold increase in the adjusted odds of developing DR (OR = 12.824; 95% CI 3.583, 45.897). Moreover, a non-linear association between the RC/HDL-c ratio and PDR was observed, with an inflection point occurring at 0.90. When the RC/HDL-c ratio was below 0.90, a one-unit increase in the ratio was linked to a 1.46-fold increase in the adjusted odds of PDR (OR = 2.459; 95% CI: 1.245, 4.857).
Conclusion: This study contributes valuable insights into the intricate association between the RC/HDL-c ratio and both DR and PDR in individuals diagnosed with T2DM. By identifying a non-linear association, our findings enhance the existing knowledge surrounding the link between the RC/HDL-c ratio and the development of DR and PDR.
Keywords: Diabetic retinopathy; Generalized additive model; Non-linear; Proliferative diabetic retinopathy; Remnant cholesterol/high-density lipoprotein cholesterol ratio.
© 2025. The Author(s).
Conflict of interest statement
Declarations. Ethics approval and consent to participate: In their previous publication, Chen et al. clearly stated that this study was conducted with the approval of the institutional review board at Kaohsiung Medical University Hospital (Approval No. KMUHIRB-E-20150029) and in accordance with the ethical principles outlined in the Declaration of Helsinki. Prior to participating, all patients willingly provided their informed consent. Consent for publication: Not applicable. Competing interests: The authors declare no competing interests.
Figures


References
Grants and funding
LinkOut - more resources
Full Text Sources
Miscellaneous
