. 2025 May 25;15(1):18181.
doi: 10.1038/s41598-025-00438-z.

A next-generation system for smoke inhalation integrated with a breathing lung-on-chip to model human lung responses to cigarette exposure

Affiliations

A next-generation system for smoke inhalation integrated with a breathing lung-on-chip to model human lung responses to cigarette exposure

Arunima Sengupta et al. Sci Rep. .

Abstract

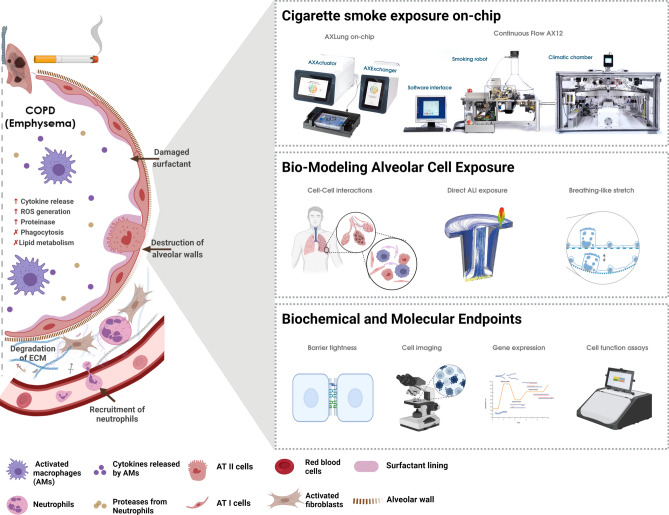
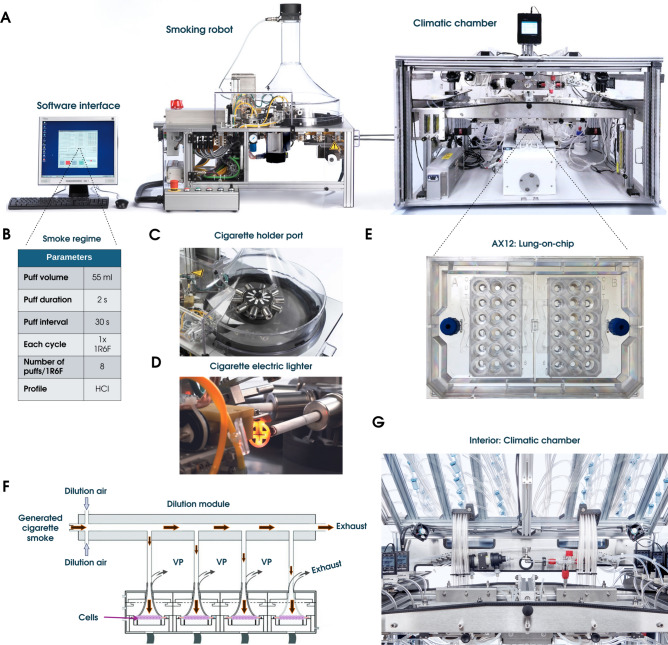
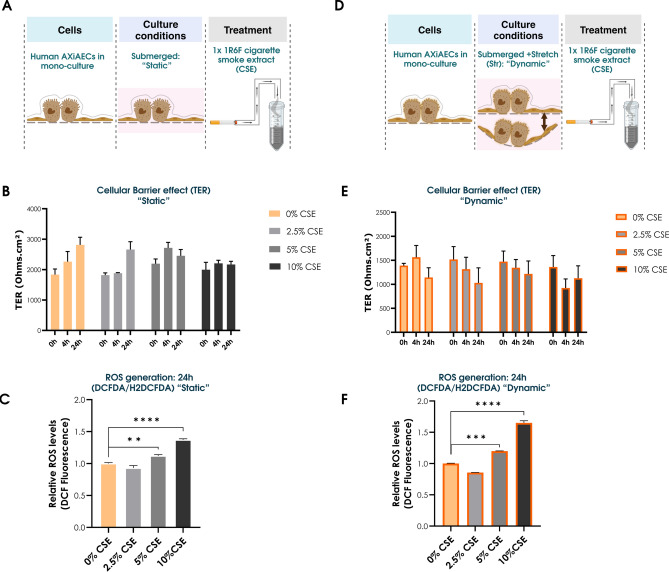
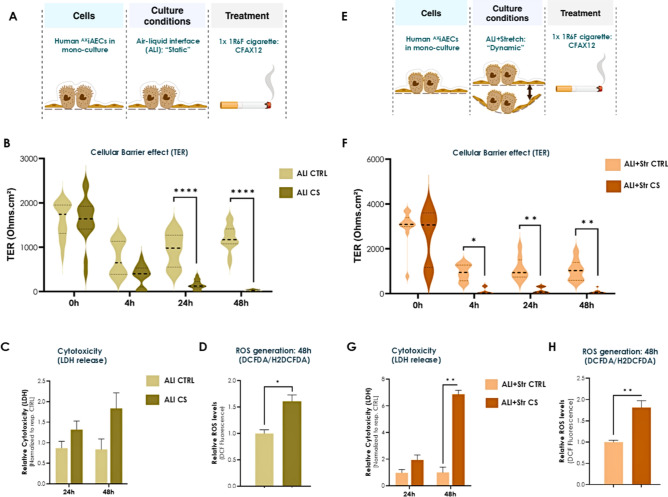
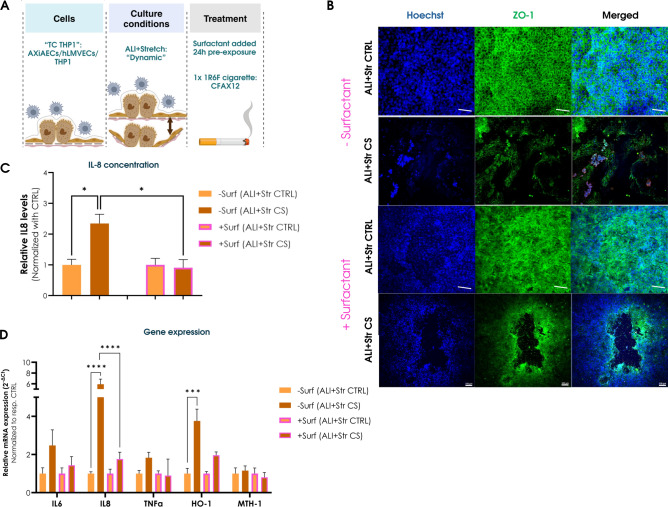
Continuous exposure to cigarette smoke (CS) significantly contributes to the development and progression of chronic obstructive pulmonary disease (COPD) and lung cancer. Animal models that inhale smoke nasally and have different lung physiology from humans may not accurately replicate cigarette smoke-induced health effects. Furthermore, traditional in vitro models fail to replicate the lung's dynamic mechanical forces and realistic inhalation exposure patterns, limiting their relevance in preclinical research. Here, we introduce an advanced smoke inhalation-based lung-on-chip system, the Continuous Flow AX12 (CFAX12), to investigate CS-induced cellular responses in a physiologically relevant manner. Unlike previous technologies, the CFAX12 integrates cyclic mechanical stretch with controlled whole-smoke exposure, allowing for a more accurate recreation of CS-induced alveolar microenvironment dynamics and barrier integrity responses. Using human alveolar epithelial cells, lung microvascular endothelial cells, and macrophages in mono- and co-culture models under air-liquid interface (ALI) conditions with breathing-like stretch (Str), we simulated key lung microenvironment features. Our results show that CS exposure using the CFAX12 induced a ~ 60% reduction in trans-barrier electrical resistance (TER), increased ROS generation depending on cellular model complexity, and a ~ 4.5-fold increase in IL-8 gene expression, all key hallmarks of early COPD pathogenesis. These findings underscore smoke-induced epithelial damage, inflammation, and oxidative stress, all of which contribute to alveolar barrier dysfunction and disease progression. Also, CFAX12 provides a more physiologically relevant alternative to submerged cigarette smoke extract (CSE) treatments, offering controlled whole-smoke exposure using the VC10 Smoking Robot, ensuring precisely regulated smoke delivery. Additionally, inclusion of pulmonary surfactant reduced IL8 gene levels by ~ 5 folds. Hence, by integrating mechanical and biological complexity, CFAX12 offers a robust platform for assessing inhaled smoke effects and identifying therapeutic targets. It's application in COPD drug screening can facilitate the discovery of compounds that preserve alveolar integrity, reduce inflammation, and mitigate oxidative damage, ultimately bridging the gap between regulatory and preclinical research applications.

Keywords: Air–liquid interface; Alveolar toxicity; CSE; Cigarette smoke; Inhalation; Lung-on-chip; Stretch.


Conflict of interest statement

Declarations. Competing interests: OG and NH hold equity in AlveoliX, NH in Alexis Technologies. AH and NH are employed by AlveoliX. AS, SS, AD and NG are employed by Alexis Technologies. HOW, MH and TK are employed by VITROCELL Systems GmbH. VV declares that her spouse is employed by Philip Morris International. The remaining authors declare that the research was conducted without any commercial or financial relationships that could be construed as a potential conflict of interest.

Figures

Fig. 1
Fig. 1
Critical role of the lung microenvironment in mediating the effects of cigarette smoke on alveolar health. (Left) Schematic representation of cellular and molecular alterations in the alveolar region due to CS exposure, illustrating key processes such as cytokine release, reactive oxygen species (ROS) generation, increased protease activity, phagocytosis, altered lipid metabolism, degradation of the extracellular matrix (ECM), and recruitment of neutrophils. Various cell types, including activated macrophages (AMs), neutrophils, alveolar type I (AT I) and type II (AT II) cells, and activated fibroblasts, are depicted in the context of emphysematous (COPD) damage. (Right top) Experimental setup used for cigarette smoke exposure, featuring the AX12 Lung-on-Chip system and Continuous Flow AX12 (CFAX12). (Right middle) Overview of the different exposure conditions employed in the study, including use of different cell types, air–liquid interface (ALI) exposure and physiological stretch conditions. (Right bottom) Summary of the key endpoints measured in the study, like barrier health, cellular morphology via imaging, gene expression analysis to monitor changes at the molecular level and functional assays to evaluate cytotoxicity, ROS generation, and other cellular functions.
Fig. 2
Fig. 2
Components of the CFAX12 System. (A) Overview of the three main elements of the CFAX12 (from left to right): the computer system with the software interface, the VC10 smoking robot and the Climatic chamber. (B) The operation is controlled via a software interface where the Health Canada Intense (HCI) smoking regime was selected. (C) The cigarettes are loaded into the cigarette holders fully automatically and without damage, with the rotation of the holder controlled by a stepper motor. (D) The electric lighter to ensure automatic and contactless ignition. (E) The lung-on-chip consumable, AX12. (F) The VC10 smoking robot initiates the process delivering the smoke to the dilution system, where dilution air is added to the smoke feed stream. The whole smoke dilutes in the dilution module, passes through the exposure head, and reaches the AX12 with the cells seeded, secured in the exposure module. A sample flow generated by a vacuum pump (VP) diverts the aerosol towards the cells via “trumpet” inlets, and after contacting the cells, the smoke exits through an exhaust tube; the continuous dilution air flow ensures that any remaining smoke is also exhausted. (G).
Fig. 3
Fig. 3
Dose distribution and exposure analysis using the CFAX12 system (A) Diagram illustrating the airflow paths and distribution channels for cigarette smoke in the CFAX12 system. Both Chips (A and B) were exposed to cigarette smoke for this study. (B) Consistent dose distribution across multiple experimental runs (N#1, 2, 3). The graph plots indicate the relative dose received by each well (A1–A6 and B1–B6) in the AX12. The dotted lines represent the minimum and maximum acceptable dose range. (C) Image of the AX12, highlighting the positioning of Chip A and Chip B containing six individual alveolar units each. Heatmap and bar graph depict the dose distribution across the wells of the AX12 chip based on fluorescence intensity (in RFU—Relative Fluorescence Units). (D) Schematic airflow paths for cigarette smoke in Chip B and control air in Chip A in the setup for nicotine distribution study. (E) Concentration of nicotine (in ng/ml) within the wells of Chip A and Chip B is depicted. The individual dots represent measurements from specific wells. Lower limit of quantification (LLOQ) for nicotine concentration was at 1 ng/ml. Data are shown as mean ± SEM.
Fig. 4
Fig. 4
CSE treatment induced oxidative stress without affecting barrier integrity. (A) Overview of cells (AXiAECs), culture conditions (static) and treatment (CSE) performed. (B) TER (Ohm cm2) measured in “static” conditions pre-treatment at 0 h and 4 h and 24 h post-treatment of CSE (0%: Control, 2.5%, 5% and10%) (N = 2; n = 5–6/concentration). (C) ROS generation was measured in the “static” conditions using the DCFDA assay (N = 2; n = 3/concentration). Fluorescence intensity for treated cells were normalized with control (0% CSE) non-treated cells. (D) Overview of cells (AXiAECs) used, culture conditions (dynamic) and treatment (CSE) performed. (E) TER (Ohm.cm2) measured in “dynamic” conditions pre-treatment at 0 h and 4 h and 24 h post-treatment of CSE (0%: Control, 2.5%, 5% and10%) (N = 2; n = 5–6/concentration). (F) ROS generation was measured in the “dynamic” conditions using the DCFDA assay (N = 2; n = 3/concentration). Fluorescence intensity for treated cells were normalized with control (0% CSE) non-treated cells. Data are shown as mean ± SEM.
Fig. 5
Fig. 5
CS exposure under ALI dynamic conditions induce early barrier disruption and increased cytotoxicity than ALI static. (A) Overview of cells (AXiAECs), culture conditions (static) and treatment (CS exposure) performed. (B) TER (Ohm cm2) measured in “ALI, static” conditions pre-exposure at 0 h and 4 h, 24 h and 48 h post-exposure to CS (N = 3; n = 14–16/time-point). Data are shown as violin plots, medians are indicated by black dotted lines. (C) Cytotoxicity was calculated from LDH release at 24 h and 48 h after CS exposure (N = 3; n = 6/time-point). (D) ROS generation was measured in the “static” conditions using the DCFDA assay (N = 2; n = 4). Fluorescence intensity for treated cells were normalized with control (CTRL) pure air exposed cells. (E) Overview of cells (AXiAECs), culture conditions (dynamic; ALI + Str) and treatment (CS exposure) performed. (F) TER (Ohm cm2) measured in “ALI + Str” conditions pre-exposure at 0 h and 4 h, 24 h and 48 h post-exposure to CS (N = 3; n = 14–16/time-point). Data are shown as violin plots, medians are indicated by black dotted lines. (G) Cytotoxicity was calculated from LDH release at 24 h and 48 h after CS exposure (N = 3; n = 6/time-point). (H) ROS generation was measured in the “ALI + Str” conditions using the DCFDA assay (N = 2; n = 4). Fluorescence intensity for treated cells were normalized with control (CTRL) pure air exposed cells.
Fig. 6
Fig. 6
Differential effects of CS exposure on various co-culture dynamic models. (A) Overview of cells used in the dual culture “DC” (AXiAECs/hLMVECs), culture conditions (dynamic; ALI + Str) and treatment (CS exposure) performed. (B) Overview of cells used in the triple culture “TC pBDMs” (AXiAECs/hLMVECs/pBDMs) and “TC THP1” (AXiAECs/hLMVECs/THP1), culture conditions (dynamic; ALI + Str) and treatment (CS exposure) performed. (C) TER (Ohm cm2) measured in “ALI + Str” conditions pre-exposure at 0 h and 4 h, 24 h and 48 h post-exposure to CS in DC (N = 3; n = 3/time-point), in TC pBDMs (N = 2; n = 3/time-point) and TC THP1 (N = 3; n = 3/time-point). Data are shown as violin plots, medians are indicated by black dotted lines. (D) The levels of IL-8 (pg/ml) in the supernatants collected from the cells were measured by ELISA in all the co-culture models. (E) Cytotoxicity was calculated from LDH release at 48 h time-point after CS exposure (N = 2; n = 3/time-point for all models). Data are shown as mean ± SEM.
Fig. 7
Fig. 7
Apical surfactant addition demonstrates potential protective effects against CS exposure. (A) Overview of cells used in the triple culture “TC THP1” (AXiAECs/hLMVECs/THP1), culture conditions (dynamic; ALI + Str) and treatment (Surfactant pre-treated followed by CS exposure) performed. (B) Representative immunofluorescence staining of CTRL ALI + Str (− Surfactant) cells (top row; scale bar 50 µm), CS exposed ALI + Str (-Surfactant) cells (second row; scale bar 50 µm), CTRL ALI + Str (+ Surfactant) cells (third row; scale bar 100 µm), CS exposed ALI + Str (+ Surfactant) cells (fourth row; scale bar 100 µm). Cells were stained for Zonula Occludens 1 (ZO-1, in green) and nuclei (Hoechst, in blue). (C) IL-8 concentration (pg/ml) measured from apical supernatants collected from the CTRL and CS exposed wells pre-treated with and without surfactant (+ Surf or -Surf) via ELISA assay (N = 2; n = 6/condition). (D) mRNA was harvested at 48 h time-point with and without surfactant (+ Surf or -Surf) post-exposure to CS. qRT-PCR study for inflammation (Interleukin 6, IL6; Interleukin 8, IL8; Tumor Necrosis Factor α, TNFα) and oxidative stress-related (Heme Oxygenase 1, HO-1; Human MutT Homolog 1, MTH-1) genes were conducted in all -Surf and + Surf CS exposed and CTRL samples (N = 2, n = 3). Data are shown as mean ± SEM.

Similar articles

References

    1. Chen, S. et al. The global economic burden of chronic obstructive pulmonary disease for 204 countries and territories in 2020–50: A health-augmented macroeconomic modelling study. Lancet Glob. Health11(8), e1183–e1193 (2023). - PMC - PubMed
    1. WHO. Smoking is the leading cause of chronic obstructive pulmonary disease (2023). https://www.who.int/news/item/15-11-2023-smoking-is-the-leading-cause-of...
    1. Parris, B. A., O’Farrell, H. E., Fong, K. M. & Yang, I. A. Chronic obstructive pulmonary disease (COPD) and lung cancer: Common pathways for pathogenesis. J. Thorac. Dis.11(Suppl 17), S2155–S2172 (2019). - PMC - PubMed
    1. Bezerra, F. S. et al. Oxidative stress and inflammation in acute and chronic lung injuries. Antioxidants12(3), 548 (2023). - PMC - PubMed
    1. Domej, W., Oettl, K. & Renner, W. Oxidative stress and free radicals in COPD-implications and relevance for treatment. Int. J. COPD9, 1207–1224 (2014). - PMC - PubMed