

Better statistical reporting does not lead to statistical rigour: lessons from two decades of pseudoreplication in mouse-model studies of neurological disorders
- PMID: 40414919
- PMCID: PMC12105375
- DOI: 10.1186/s13229-025-00663-3
Better statistical reporting does not lead to statistical rigour: lessons from two decades of pseudoreplication in mouse-model studies of neurological disorders
Abstract
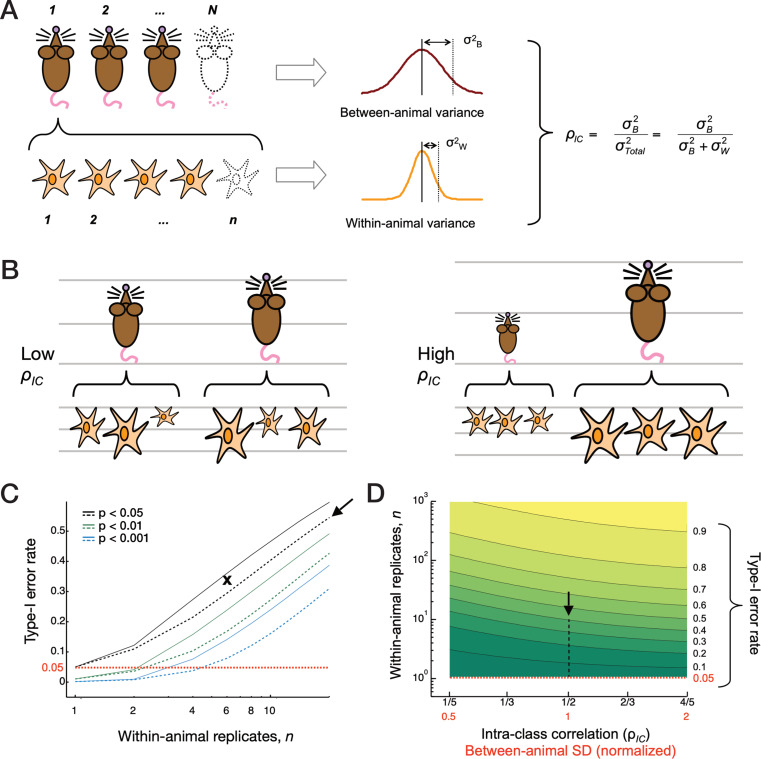
Background: Accurately determining the sample size ("N") of a dataset is a key consideration for experimental design. Misidentification of sample size can lead to pseudoreplication, a process of artificially inflating the number of experimental replicates which systematically underestimates variability, overestimates effect sizes and invalidates statistical tests performed on the data. While many journals have adopted stringent requirements with regard to statistical reporting over the last decade, it remains unknown whether such efforts have had a meaningful impact on statistical rigour.
Methods: Here, we evaluated the prevalence of this type of statistical error among neuroscience studies involving animal models of Fragile-X Syndrome (FXS) and those using animal models of neurological disorders at large published between 2001 and 2024.
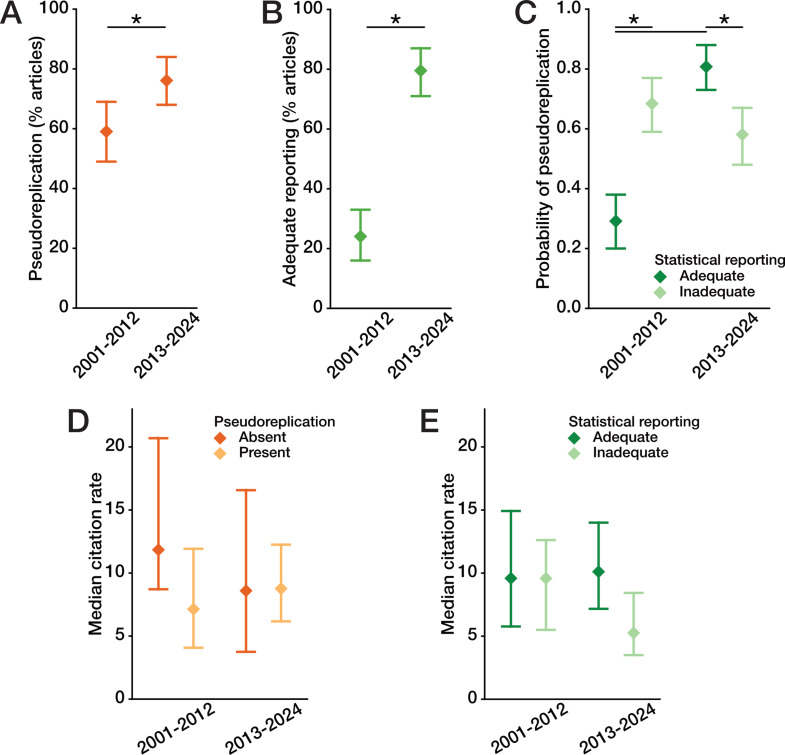
Results: We found that pseudoreplication was present in the majority of publication, increasing over time despite marked improvements in statistical reporting over the last decade. This trend generalised beyond the FXS literature to rodent studies of neurological disorders at large between 2012 and 2024, suggesting that pseudoreplication remains a widespread issue in the literature.
Limitations: The scope of this study was limited to rodent-model studies of neurological disorders which had the potential for being pseudoreplicated, by allowing repeat observations from individual animals. We did not consider reviews or articles whose experimental design could not allow for pseudoreplication, for example studies which reported only behavioural results, or studies which did not use inferential statistics.
Conclusions: These observations identify an urgent need for better standards in experimental design and increased vigilance for this type of error during peer review. While reporting standards have significantly improved over the past two decades, this alone has not been enough to curb the prevalence of pseudoreplication. We offer suggestions for how this can be remedied as well as quantifying the severity of this particular type of statistical error. Although the examined literature concerns a specific neuroscience-related area of research, the implications of pseudoreplication apply to all fields of empirical research.
Keywords: Animal models; Autism; Fragile X; Pseudoreplication; Statistics.
© 2025. The Author(s).
Conflict of interest statement
Declarations. Ethics approval and consent to participate: Not applicable. Consent for publication: Not applicable. Competing interests: Peter Kind is an Associate Editor for Molecular Autism. The authors declare no competing interests.
Figures

Similar articles
-
Folic acid supplementation and malaria susceptibility and severity among people taking antifolate antimalarial drugs in endemic areas.Cochrane Database Syst Rev. 2022 Feb 1;2(2022):CD014217. doi: 10.1002/14651858.CD014217. Cochrane Database Syst Rev. 2022. PMID: 36321557 Free PMC article.
-
Don't let spurious accusations of pseudoreplication limit our ability to learn from natural experiments (and other messy kinds of ecological monitoring).Ecol Evol. 2015 Oct 26;5(22):5295-5304. doi: 10.1002/ece3.1782. eCollection 2015 Nov. Ecol Evol. 2015. PMID: 30151132 Free PMC article.
-
[Pseudoreplication in ecological research: the problem overlooked by Russian scientists].Zh Obshch Biol. 2003 Jul-Aug;64(4):292-307. Zh Obshch Biol. 2003. PMID: 14524226 Review. Russian.
-
An entomologist guide to demystify pseudoreplication: data analysis of field studies with design constraints.J Med Entomol. 2010 May;47(3):291-8. doi: 10.1603/me09250. J Med Entomol. 2010. PMID: 20496574
-
A Bayesian predictive approach for dealing with pseudoreplication.Sci Rep. 2020 Feb 11;10(1):2366. doi: 10.1038/s41598-020-59384-7. Sci Rep. 2020. PMID: 32047274 Free PMC article.
References
-
- Gardenier J, Resnik D. The misuse of statistics: concepts, tools, and a research agenda. Account Res. 2002;9(2):65–74. - PubMed
-
- Hurlbert SH. Pseudoreplication and the design of ecological field experiments. Ecol Monogr. 1984;54(2):187–211.
-
- Forstmeier W, Wagenmakers EJ, Parker TH. Detecting and avoiding likely false-positive findings – a practical guide. Biol Rev. 2017;92(4):1941–68. - PubMed
MeSH terms
LinkOut - more resources
Full Text Sources
Medical
Miscellaneous
