. 2025 May 25;15(1):18260.
doi: 10.1038/s41598-025-02255-w.

The dynamics of stimulus selection in the nucleus isthmi pars magnocellularis of avian midbrain network

Affiliations

The dynamics of stimulus selection in the nucleus isthmi pars magnocellularis of avian midbrain network

Longlong Qian et al. Sci Rep. .

Abstract

The nucleus isthmi pars magnocellularis (Imc) serves as a critical node in the avian midbrain network for encoding stimulus salience and selection. While reciprocal inhibitory projections among Imc neurons (inhibitory loop) are known to govern stimulus selection, existing studies have predominantly focused on stimulus selection under stimuli of constant relative intensity. However, animals typically encounter complex and changeable visual scenes. Thus, how Imc neurons represent stimulus selection under varying relative stimulus intensities remains unclear. Here, we examined the dynamics of stimulus selection by in vivo recording of Imc neurons' responses to spatiotemporally successive visual stimuli divided into two segments: the previous stimulus and the post stimulus. Our data demonstrate that Imc neurons can encode sensory memory of the previous stimulus, which modulates competition and salience representation in the post stimulus. This ​history-dependent modulation is also manifested in persistent neural activity after stimulus cessation. We identified, through neural tracing, focal inactivation, and computational modeling experiments, projections from the nucleus isthmi pars parvocellularis (Ipc) to "shepherd's crook" (Shc) neurons, which could be either direct or indirect. These projections enhance Imc neurons' responses and persistent neural activity after stimulus cessation. This connectivity supports ​a Shc-Ipc-Shc excitatory loop in the midbrain network. The coexistence of ​excitatory and inhibitory loops provides ​a neural substrate for ​continuous attractor network models, ​a proposed framework for neural information representation. This study also offers a potential explanation for how animals maintain short-term attention to targets in complex and changeable environments.

Keywords: Attractor network; Dynamics; Excitatory loop; Sensory memory; Stimulus competition.


Conflict of interest statement

Competing interests: The authors declare no competing interests.

Figures
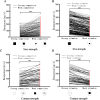
Fig. 1
Fig. 1
Joint analysis of stimulus salience and stimulus selection representation. In the figure, ellipses represent the receptive fields of recorded Imc neurons, and squares indicate moving targets. The relative size of squares reflects the relative size in stimuli, the grayscale of squares represents contrast—darker colors indicate lower contrast (contrast experiments); A, C, The comparisons of neural responses to strong vs. weak competitors under the CRI-SCP paradigm. Stimulus within the receptive field is defined as S1, and stimulus outside as S2. Using the size or contrast of S1 as the threshold, neural responses when S2 > S1 are defined as strong competitors, and those when S2 < S1 as weak competitors, with mean values calculated for the two data types separately. The object intensity variable is size in A and contrast in C. Each pair of data represents a neuron. Neural responses under strong competitors were significantly weaker than those under weak competitors (p < 0.001, n = 193 for A; p < 0.001, n = 61 for C, Wilcoxon rank-sum test). Some neurons had two S1 sizes or contrasts in spatial competition experiments. B, D, The comparisons of neural responses to strong vs. weak stimulus under the CISP paradigm. The object intensity variable is size in B and contrast in D. The thresholds for strong/weak stimuli were identical to those in A and C. Target salience under strong stimuli was significantly higher than that under weak stimuli (p < 0.001, n = 193 for B; D: p < 0.001, n = 61 for D, Wilcoxon rank-sum test).
Fig. 2
Fig. 2
The response of Imc neurons for variation relative intensity spatial competition protocol (VRI-SCP). In the figure, ellipses represent the receptive fields of recorded Imc neurons, and squares indicate moving targets. The relative size of squares reflects the relative size in stimuli, the grayscale of squares represents contrast—darker colors indicate lower contrast (contrast experiments); A, Diagram of VRI-SCP. Blue horizontal line is the dividing line between the two segments of stimulation, the up is the previous segment, the down is the post segment; Arrow, pointing in the direction of the stimulus motion; Square, the target intensity of the black square are the same and are fixed, green square are different in each trial; B, D, Raster plot of responses of the example Imc neuron to A protocols (the intensity variable of the object is the size). Shaded along the x-axis represents stimulus duration (500ms), green bar represent the previous segment, black bar represent the post segment during which response firing rates were calculated. S1, Pos-S2 = 0.6°(B), 0.9°(D). Red rectangle and triangle were the raster when S1, Pre-S1, Pos-S2 = 0.6°(B), 0.9°(D); C, E, PSTH of neurons to S1 and S2 presented together (C, Pre-S2 = 3°, 0.39° and Single S1 = 0.6°, corresponding to B. E, Pre-S2 = 3°, 0.6° and Single S1 = 0.9°, corresponding to D), computed by smoothing PSTHs (1 ms time bins) with a Gaussian kernel (SD = 20 ms; “Materials and methods”); F, Response mean firing rates corresponding to raster plots in B (red data) and D (purple data) during the post segment (black bar). Solid circle, response firing rates to paired presentation of S1 and S2 in the post segment (mean ± SEM). Correlation coefficient of responses in the post segment versus Pre-S2 intensity is -0.82 (p = 0.02, purple data), -0.82 (p = 0.02, red data), Pearson correlation test. Solid line, best fitting sigmoid to the competitor history response profile (r2 = 0.99); red and black triangle, intensity of S1 (0.6°, 0.9°); G, H, The comparisons of the post segment neural responses to strong vs. weak Pre-S2 under the CRI-SCP paradigm. Using the size or contrast of S1 as the threshold, neural responses when Pre-S2 > S1 are defined as strong Pre-S2, and those when Pre-S2 < S1 as weak Pre-S2, with mean values calculated for the two data types separately. The object intensity variable is size in G and contrast in H. The neural response of the post segment under Strong Pre-S2 was significantly weaker than that of Weak Pre-S2 (G: p < 0.001, n = 143; H: p < 0.001, n = 40, Wilcoxon signed-rank tests).
Fig. 3
Fig. 3
The response of Imc neurons for variation intensity single-target protocol (VISP). In the figure, ellipses represent the receptive fields of recorded Imc neurons, and squares indicate moving targets. The relative size of squares reflects the relative size in stimuli, the grayscale of squares represents contrast—darker colors indicate lower contrast (contrast experiments); A, Diagram of VISP, conventions are as in Fig. 2A; B, D, Raster plot of responses of the example Imc neuron to A protocols (the intensity variable of the object is the size). Conventions are as in Fig. 2B, D. Pos-S1 = 0.9° in B, Pos-S1 = 0.6° in D; C, E, PSTH of neurons to A protocols. Conventions are as in Fig. 2C, E. Response firing rates corresponding to raster plots in B, D and F, Response mean firing rates corresponding to raster plots in (B) (red data) and (D) (purple data) during the post segment (black bar), correlation coefficient of responses versus size of the previous stimulus intensity is 0.78 (Pos-S1 = 0.6, p = 0.03, Pearson correlation test), 0.84 (Pos-S1 = 0.9, p = 0.01, Pearson correlation test); G, H, The response means of the post segment of each neuron are contrasted when the Pre-S1> Pos-S1 (Strong Pre-S1) and Pre-S1< Pos-S1(Weak Pre-S1), G for different sizes of stimuli (p < 0.001, n = 143, Wilcoxon signed-rank tests), H for different contrast stimuli (p<0.001, n = 40, Wilcoxon signed-rank tests).
Fig. 4
Fig. 4
Imc neurons’ response dynamics; A, Raster plot of the example Imc neuron’s responses to targets of different sizes. Shaded along the x-axis represents stimulus duration (500 ms); B, The definition of delay time and persistence time. The black curve is the PSTH of the Imc neurons’ response, with stimuli presented at 0–500 ms. The bottom gray dashed line is the 10% of the maximum neural response (upper gray dashed line), it defines the dividing line at which the neural response begins and ends. The green interval is the delay time, the red interval is the persistence time; C, The contrast of the delay time and the persistence time of Imc neurons population. Size = 3°, n = 122, P<0.001, Wilcoxon signed-rank tests; D, E, F, Statistics of delay time, persistence time, and persistence intensity of example Imc neurons to targets of different sizes. Correlation coefficient of delay time and persistence time versus size intensity = -0.65 (p = 0.04), 0.75 (p = 0.01), Pearson correlation test). Correlation coefficient of persistence intensity (means of FR 250ms after the stimulus cessation) versus size intensity = 0.8 (p = 0.005, Pearson correlation test); G, H, I, Statistics of delay time, persistence time, and persistence intensity of Imc neurons population to stimuli of different sizes, n = 122. Correlation coefficient of mean delay time and mean persistence time versus size intensity = -0.74 (p = 0.01), 0.91 (p <0.001), Pearson correlation test. Correlation coefficient of mean persistence intensity versus size intensity = 0.91 (p<0.001, Pearson correlation test).
Fig. 5
Fig. 5
In vivo injections of HSV-EGFP viral vectors in Ipc. A, Schematic diagram of the anterograde tracing, the red dotted line is the pathway to be verified; B, Brain slice scanning results of the anterograde tracer experiment. Experiments were conducted in three subjects, revealing robust fluorescence expression in OT layer 10 (L10). The lower-left panel shows a magnified view of Shc neurons within OT L10, whose cytoarchitecture matches documented morphological features.
Fig. 6
Fig. 6
Ipc inactivation effects on Imc neurons with overlapping receptive fields; A, Midbrain circuit diagram: red arrows denote excitatory projections, gray arrows inhibitory connections; B, Receptive field mapping: upper/lower panels show Imc/Ipc neuron receptive field locations on visual display; C, Raster plots of an exemplar Imc neuron under three conditions (left to right): pre-inactivation baseline, Ipc saline injection, and Ipc lidocaine administration. Stimulus duration (500 ms) marked by gray shading; D, E, F, Quantitative metrics for exemplar neurons: response intensity (D), persistence intensity (E), and persistence duration (F). Data points colored black (baseline), green (saline), red (lidocaine); G, H, I, Population-level comparisons: lidocaine-induced reductions in response intensity (G, p < 0.001), persistence intensity (H, p < 0.001), and persistence duration (I, p < 0.001) versus saline controls (Wilcoxon signed-rank tests).
Fig. 7
Fig. 7
Response of model Imc neurons with/without SC-Ipc-SC excitatory loops; A, Raster plots of model Imc activity under varying Shc input intensities (250–1000 spikes/s). Black/red data indicate loop presence/absence; B, C, D, Quantitative metrics across input frequencies (250–1000 spikes/s): response intensity (B), persistence intensity (C), and persistence time (D). Black/red data points represent loop-present/absent conditions respectively.

Similar articles

References

    1. Knudsen, E. I. Neural circuits that mediate selective attention: a comparative perspective. Trends Neurosci.41 (11), 789–805 (2018). - PMC - PubMed
    1. Knudsen, E. I. Control from below: the role of a midbrain network in Spatial attention. Eur. J. Neurosci.33 (11), 1961–1972 (2011). - PMC - PubMed
    1. Krauzlis, R. J., Lovejoy, L. P. & Zénon, A. Superior colliculus and visual Spatial attention. Annu. Rev. Neurosci.36, 165–182 (2013). - PMC - PubMed
    1. Graybiel, A. M. A satellite system of the superior colliculus: the parabigeminal nucleus and its projections to the superficial collicular layers. Brain Res.145 (2), 365–374 (1978). - PubMed
    1. Sereno, M. I. & Ulinski, P. S. Caudal topographic nucleus Isthmi and the rostral nontopographic nucleus Isthmi in the turtle, Pseudemys scripta. J. Comp. Neurol.261 (3), 319–346 (1987). - PubMed

LinkOut - more resources