. 2025 May 25;15(1):18172.
doi: 10.1038/s41598-025-03260-9.

Targeting of the IL-33/Wnt axis restricts breast cancer stemness and metastasis

Affiliations

Targeting of the IL-33/Wnt axis restricts breast cancer stemness and metastasis

Guanglin Fan et al. Sci Rep. .

Abstract

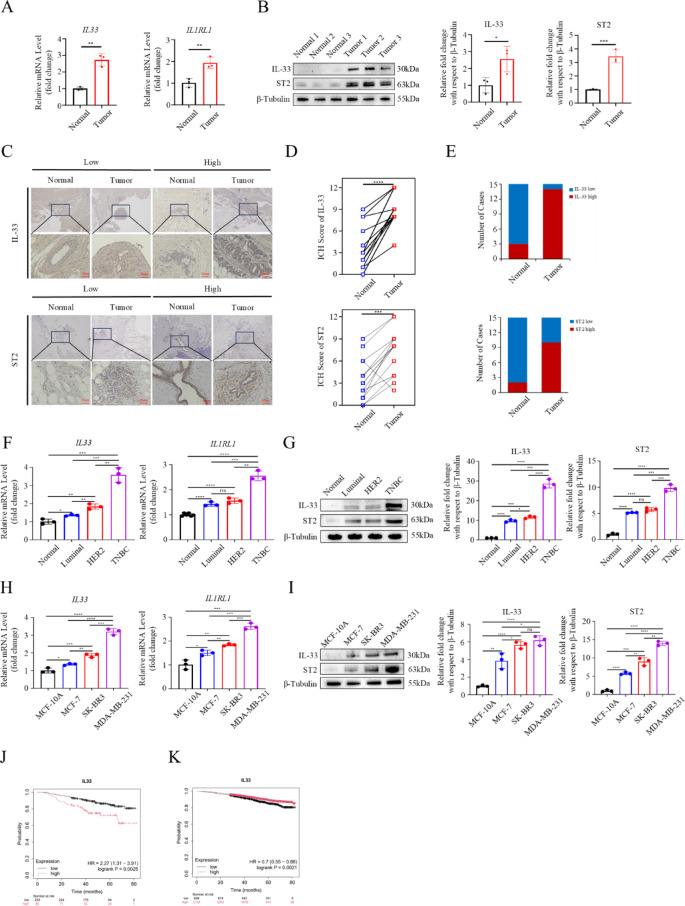
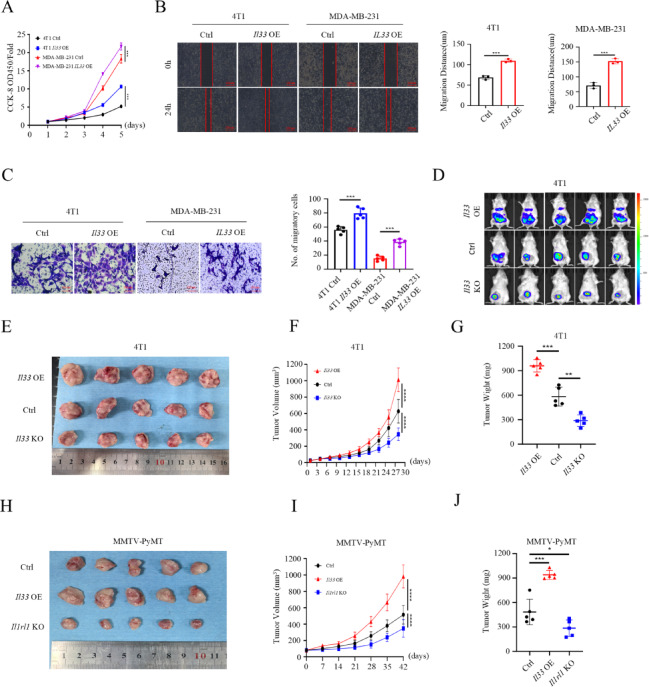
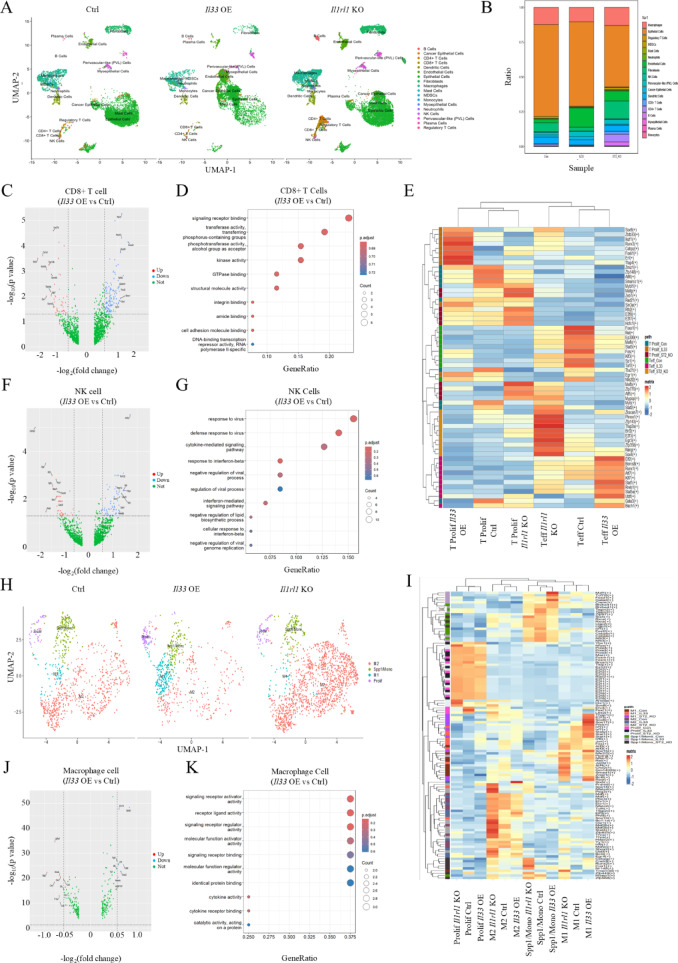
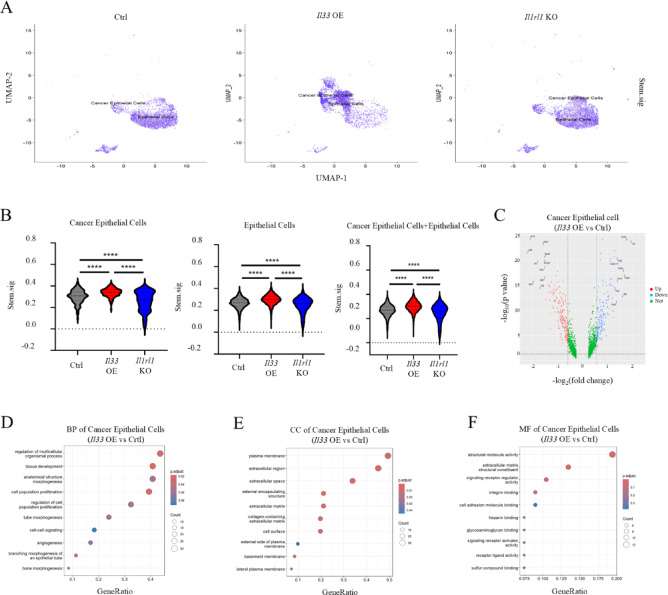
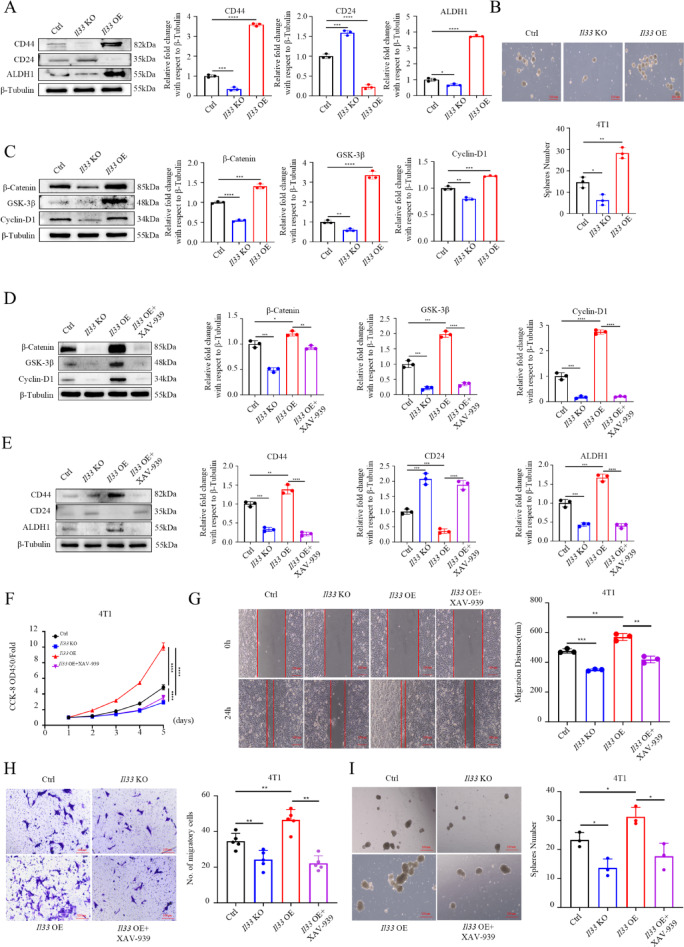
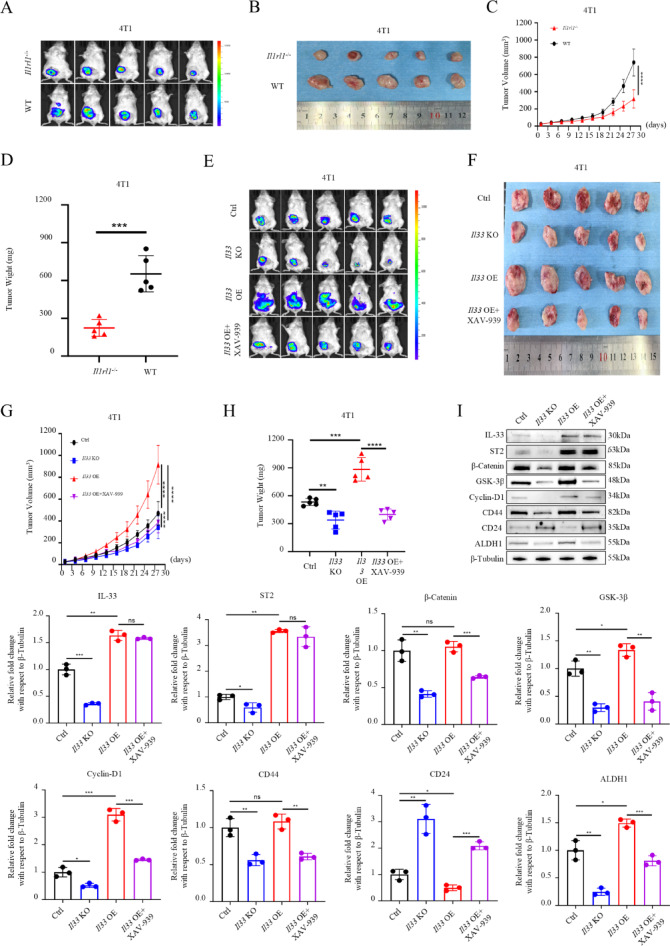
Interleukin-33 (IL-33) plays multifaceted roles in tumor progression, but its autocrine regulation of breast cancer stemness and metastasis via the Wnt pathway remains unclear. Here, we investigated the IL-33/ST2 axis in breast cancer using CRISPR/Cas9, single-cell RNA sequencing, and murine models (orthotopic 4T1 and spontaneous MMTV-PyMT). Elevated IL-33 levels correlated with aggressive subtypes and poor prognosis. IL-33 overexpression enhanced proliferation, migration, and cancer stem cell (CSC) marker expression (CD44, ALDH1) in 4T1 and MDA-MB-231 cells, whereas ST2 knockdown via CRISPR or adeno-associated virus (AAV) attenuated tumor growth and metastasis in vivo, reducing CSC frequency. Mechanistically, IL-33 activated Wnt/β-catenin signaling to promote stemness, which was reversed by the Wnt inhibitor XAV-939. Single-cell analysis revealed that IL-33 overexpression skewed the immune microenvironment toward immunosuppression, while ST2 knockdown restored antitumor immunity. Our findings establish an IL-33-Wnt axis as a critical driver of breast cancer aggressiveness and propose AAV-mediated ST2 silencing as a novel therapeutic strategy. Targeting this axis may offer dual benefits by suppressing stemness and enhancing immune surveillance, warranting clinical exploration for advanced breast cancer.

Keywords: Breast cancer stem cells; IL-33; Immunotherapy; ST2 knockdown; Wnt pathway.


Conflict of interest statement

Declarations. Competing interests: The authors declare no competing interests.

Figures

Fig. 1
Fig. 1
IL-33 expression in breast cancer correlates with malignancy. (A) qRT-PCR and (B) Western blot analyses demonstrating IL-33 and ST2 mRNA and protein expression in tumor and adjacent normal tissues. (C) Immunohistochemical staining showing IL-33 and ST2 distribution in tumor and adjacent normal tissues (n = 15; scale bar: 50μm). (D) Quantitative immunohistochemical scores for IL-33 and ST2 in paired tumor and adjacent normal tissues. (E) Statistical comparison of IL-33 and ST2 expression between tumor and adjacent normal tissues. (F) qRT-PCR and (G) Western blot analyses showing IL-33 and ST2 mRNA and protein expression profiles across different breast cancer molecular subtypes. (H) qRT-PCR and (I) Western blot analyses of IL-33 and ST2 mRNA and protein expression in breast cancer cell lines representing different molecular subtypes. (J) Kaplan–Meier analysis showing correlation between IL-33 expression and overall survival in untreated breast cancer patients. (K) Kaplan–Meier analysis showing correlation between IL-33 expression and overall survival in all breast cancer patients (both untreated and treated). Data are presented as mean ± SD from three independent experiments. *P < 0.05, **P < 0.01, ***P < 0.001, ****P < 0.0001.
Fig. 2
Fig. 2
IL-33 promotes breast cancer progression and metastasis. (A) Cell proliferation analysis using CCK-8 assays comparing IL-33-overexpressing versus control 4T1 and MDA-MB-231 cells. (B) Migration analysis via scratch assays of IL-33-overexpressing versus control cells (scale bar: 100μm). (C) Invasion capacity assessed by transwell assays (scale bar: 100μm). (D) Bioluminescence imaging of BALB/c mice (n = 5/group) at two weeks post-injection with 5 × 10^5 4T1-luc cells (control, Il33-knockout, or Il33 overexpressing variants). (E) Representative images of excised tumors at 1-month post-implantation. (F) Tumor volume progression curves. (G) Final tumor weights at 1-month post-implantation. (H) Representative images of tumors from MMTV-PyMT mice (n = 5/group) following six weeks of treatment with control, IL-33-overexpressing, or ST2-knockout AAV. (I) Tumor volume progression in AAV-treated MMTV-PyMT mice. (J) Final tumor weights at six weeks post-AAV treatment. Data represent mean ± SD from three independent experiments. *P < 0.05, **P < 0.01, ***P < 0.001, ****P < 0.0001.
Fig. 3
Fig. 3
IL-33 modulates immune cell populations within the tumor microenvironment. (A) UMAP visualization of tumor-associated cells from MMTV-PyMT mice treated with control, IL-33-overexpressing, or ST2-knockout AAV. (B) Relative proportions of identified cell populations. (C) Differential gene expression in CD8 + T cells between IL-33-overexpressing and control groups displayed as volcano plot. (D) KEGG pathway analysis of differentially expressed genes in CD8 + T cells. (E) Heatmap showing differential gene expression in proliferating and effector T cells across treatment groups. (F) Differential gene expression analysis in NK cells between Il33-overexpressing and control conditions. (G) KEGG pathway analysis of NK cell differential genes. (H) UMAP visualization of macrophage subpopulations across treatment groups. (I) Heatmap showing differential gene expression across macrophage subsets. (J) Volcano plot of differential gene expression in macrophages between Il33-overexpressing and control conditions. (K) KEGG pathway analysis of differentially expressed macrophage genes.
Fig. 4
Fig. 4
IL-33 enhances tumor cell numbers and stemness characteristics. (A) UMAP visualization of stromal and tumor cells from MMTV-PyMT mice treated with control, Il33-overexpressing, or Il1rl1-knockout AAV. (B) Quantitative analysis of cancer epithelial and epithelial cell populations across treatment conditions. (C) Differential gene expression analysis in cancer epithelial cells between Il33-overexpressing and control conditions presented as volcano plot. (DF) KEGG pathway enrichment analysis of differentially expressed genes categorized by (D) biological processes, (E) cellular components, and (F) molecular functions.
Fig. 5
Fig. 5
IL-33 promotes breast cancer cell stemness through Wnt signaling pathway activation. (A) Western blot analysis of BCSC markers CD44, CD24, and ALDH1 in control, Il33-knockout, and Il33-overexpressing 4T1 cells. (B) Tumor sphere formation capacity quantified by sphere number and size. (C) Western blot analysis of Wnt signaling proteins β-catenin, GSK-3β, and Cyclin-D1. (D) Analysis of Wnt signaling proteins in control cells and Il33-overexpressing cells ± XAV-939 inhibitor. (E) BCSC marker expression in cells treated as in (D). (F) Cell proliferation analysis of control and Il33-overexpressing cells ± XAV-939. (G) Migration assay of cells treated as in (F) (scale bar: 100μm). (H) Invasion capacity of treated cells (scale bar: 100μm). (I) Sphere formation capacity of treated cells. Data represent mean ± SD from three independent experiments. *P < 0.05, **P < 0.01, ***P < 0.001, ****P < 0.0001.
Fig. 6
Fig. 6
Therapeutic targeting of IL-33/ST2 axis or Wnt pathway attenuates breast cancer progression. (A) Bioluminescence imaging of wild-type and Il1rl1-knockout BALB/c mice at two weeks post-injection with 4T1-luc cells (5 × 10^5). (B) Representative images of excised tumors at 1-month post-implantation (n = 5/group). (C) Tumor volume progression curves in wild-type and Il1rl1 knockout BALB/c mice. (D) Final tumor weights of wild-type and Il1rl1 knockout BALB/c mice. (E) Bioluminescence imaging of BALB/c mice injected with control, Il33-knockout, Il33-overexpressing, or Il33-overexpressing + XAV-939 4T1-luc cells. (F) Representative tumor images at 1 month. (G) Tumor volume progression in BALB/c mice injected with control, Il33 knockout, Il33 high expression or Il33 high expression + XAV-939 4T1-luc cells. (H) Final tumor weight of BALB/c mice injected with control, Il33 knockout, Il33 high expression or Il33 high expression + XAV-939 4T1-luc cells. (I) Western blot analysis of key signaling proteins in tumor tissues across treatment groups. Data represent mean ± SD from three independent experiments. *P < 0.05, **P < 0.01, ***P < 0.001, ****P < 0.0001.

Similar articles

References

    1. Siegel, R. L., Giaquinto, A. N. & Jemal, A. Cancer statistics. CA Cancer J. Clin.74, 12–49, (2024). 10.3322/caac.21820 (2024). - PubMed
    1. Dillekås, H., Rogers, M. S. & Straume, O. Are 90% of deaths from cancer caused by metastases? Cancer Med.8, 5574–5576. 10.1002/cam4.2474 (2019). - PMC - PubMed
    1. Clevers, H. The cancer stem cell: Premises, promises and challenges. Nat. Med.17, 313–319. 10.1038/nm.2304 (2011). - PubMed
    1. Yang, F., Xu, J., Tang, L. & Guan, X. Breast cancer stem cell: The roles and therapeutic implications. Cell. Mol. Life Sci.74, 951–966. 10.1007/s00018-016-2334-7 (2017). - PMC - PubMed
    1. Al-Hajj, M., Wicha, M. S., Benito-Hernandez, A., Morrison, S. J. & Clarke, M. F. Prospective identification of tumorigenic breast cancer cells. Proc. Natl. Acad. Sci. U.S.A.100, 3983–3988. 10.1073/pnas.0530291100 (2003). - PMC - PubMed

MeSH terms