. 2025 May 25;16(1):923.
doi: 10.1007/s12672-025-02781-z.

A four gene risk score model for prognosis and immune microenvironment insights in small cell lung cancer based on CAF functional-related genes

Affiliations

A four gene risk score model for prognosis and immune microenvironment insights in small cell lung cancer based on CAF functional-related genes

Yunfei Chen et al. Discov Oncol. .

Abstract

Small cell lung cancer (SCLC) is still one of the most formidable challenges in oncology. In this study, we introduce an innovative risk scoring model rooted in cancer-associated fibroblast (CAF)-related functional genes, designed to predict patient prognosis and illuminate the microenvironment of SCLC. Through Kaplan-Meier survival analysis and receiver operating characteristic (ROC) curves, our model could effectively classify patients into high- and low-risk groups, with distinct survival outcomes and remarkable predictive accuracy, which has been evidenced by the AUC values. The low-risk patients showed a more active immune environment, characterized by more infiltration of dendritic cells, natural killer cells, and higher expression of immune co-stimulation molecules. On the contrary, high-risk patients displayed an enrichment of DNA repair and glycolysis pathways associated with tumor aggressiveness and treatment resistance. These results suggest that the risk model offers a nuanced view of response to immunotherapy that may guide the identification of patients who may benefit from immunotherapy. Moreover, we also verified the function of the key gene UBE2E2 by SCLC cell line experiments. Silencing UBE2E2 results in decreased cell proliferation and migration as well as increased apoptosis, which enhances its important role in SCLC biology. In summary, our study highlights the prognostic potential of the CAF-related functional gene risk model and its implications for predicting immune microenvironment status and guiding SCLC treatment strategies.

Keywords: Cancer-associated fibroblast; Predictive model; Small cell lung cancer; Tumor immune microenvironment.


Conflict of interest statement

Declarations. Ethics approval and consent to participate: This study was approved by the Institutional Review Board of Zhejiang Cancer Hospital (Approval No. IRB-2024-301) and conducted in accordance with the Declaration of Helsinki. Written informed consent was waived by the ethics committee due to the retrospective nature of the study and the use of anonymized archival specimens. Consent for publication: All authors agree to publish. Competing interests: The authors declare no competing interests.

Figures

Fig. 1
Fig. 1
The flowchart of overall study
Fig. 2
Fig. 2
Annotation of cell types in the SCLC TME. A Using PCA-derived significant components, cells were clustered into 18 distinct groups via the UMAP algorithm. B Classification of the 18 clusters into six main cell types. C Dot plot showing the expression of marker genes across the six identified cell types
Fig. 3
Fig. 3
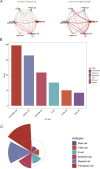
Cell–cell communication and contribution analysis. A Cell–cell interaction network. B The comparison of the total interaction network among six cell types. C Distribution of contribution scores for the six cell types
Fig. 4
Fig. 4
Construction of the prognostic risk model. A Distribution of Lasso coefficients for prognostic genes. B Selection of the optimal lambda value for the Lasso model using tenfold cross-validation. C Gene coefficients in the model. D, E Kaplan–Meier survival analysis for the high-risk and low-risk groups in the GEO training and testing cohorts. F, G Time-dependent ROC curves for 3-, 4-, and 5-year survival in the training and testing cohorts, demonstrating the model’s predictive performance
Fig. 5
Fig. 5
Validation of the prognostic model in external cohorts and Cox regression analysis. A Kaplan–Meier survival curve for George’s cohort. B Kaplan–Meier survival curve for the TCGA-NSCLC cohort. C Univariate Cox regression analysis to assess the prognostic significance of the risk score and clinical factors. D Multivariate Cox regression analysis highlighting the risk score as an independent prognostic factor in SCLC
Fig. 6
Fig. 6
Construction of the nomogram model. A Nomogram combining the risk score and clinical features to predict OS in SCLC patients. B Calibration curves showing the predicted OS at 1-year and 3-year intervals. C Time-dependent ROC curves illustrating the predictive accuracy. D DCA comparing the clinical utility of the risk score and other clinical features
Fig. 7
Fig. 7
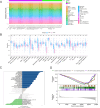
Immune infiltration and molecular mechanism analysis in of two risk groups. A Relative proportions of immune cell subtypes in two different groups. B Differences in 29 immune cells and molecules highlighted significant differences in the immune TME between groups. C GSVA analysis highlighting hallmark pathways associated with the risk score. D GSEA analysis of KEGG pathways demonstrating significant enrichment of specific signaling pathways linked to the risk score
Fig. 8
Fig. 8
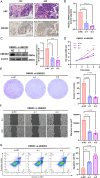
Functional validation of UBE2E2 knockdown in SCLC cells. A H&E and IHC staining at 10 × and 40 × magnification, demonstrating high expression of UBE2E2 in SCLC tumor cells. B Validation of UBE2E2 knockdown efficiency using qRT-PCR. C Western blot analysis confirming UBE2E2 protein knockdown efficiency after siRNA treatment. D CCK-8 assay demonstrating a significant decrease in cell viability in UBE2E2- knockdown cells. E Colony formation assay and corresponding quantification, showing reduced clonogenic capacity in UBE2E2-knockdown cells. F Wound healing assay and statistical analysis revealing impaired migratory capacity of DMS53 cells following UBE2E2 knockdown. G Flow cytometry analysis of apoptosis, including quantification of early and late apoptotic cells

Similar articles

References

    1. Rudin CM, Brambilla E, Faivre-Finn C, Sage J. Small-cell lung cancer. Nat Rev Dis Primers. 2021;7(1):3. 10.1038/s41572-020-00235-0. - PMC - PubMed
    1. Megyesfalvi Z, Gay CM, Popper H, Pirker R, Ostoros G, Heeke S, et al. Clinical insights into small cell lung cancer: tumor heterogeneity, diagnosis, therapy, and future directions. CA Cancer J Clin. 2023;73(6):620–52. 10.3322/caac.21785. - PubMed
    1. Siegel RL, Miller KD, Jemal A. Cancer statistics, 2020. CA Cancer J Clin. 2020;70(1):7–30. 10.3322/caac.21590. - PubMed
    1. Chen Y, Li H, Fan Y. Shaping the tumor immune microenvironment of sclc: mechanisms, and opportunities for immunotherapy. Cancer Treat Rev. 2023;120:102606. 10.1016/j.ctrv.2023.102606. - PubMed
    1. Tian Y, Li Q, Yang Z, Zhang S, Xu J, Wang Z, et al. Single-cell transcriptomic profiling reveals the tumor heterogeneity of small-cell lung cancer. Signal Transduct Target Ther. 2022;7(1):346. 10.1038/s41392-022-01150-4. - PMC - PubMed

LinkOut - more resources