

Prediction of reproductive and developmental toxicity using an attention and gate augmented graph convolutional network
- PMID: 40415056
- PMCID: PMC12104357
- DOI: 10.1038/s41598-025-02590-y
Prediction of reproductive and developmental toxicity using an attention and gate augmented graph convolutional network
Abstract
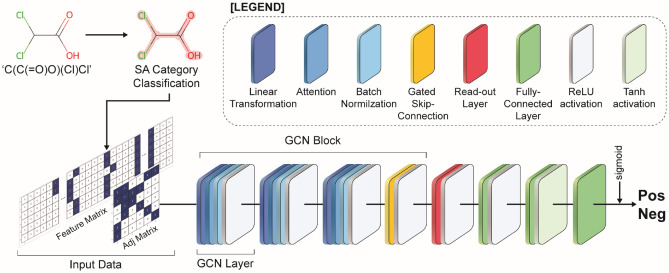
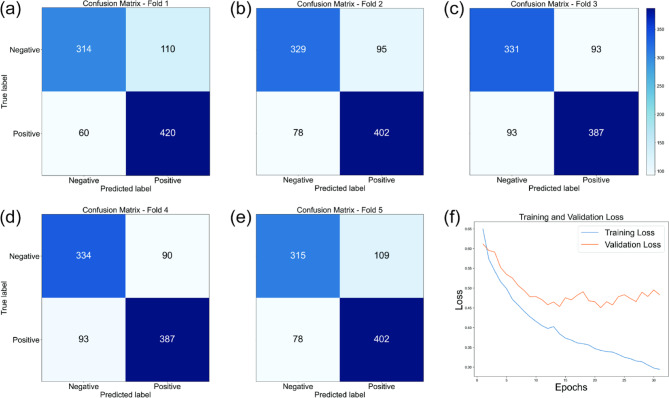
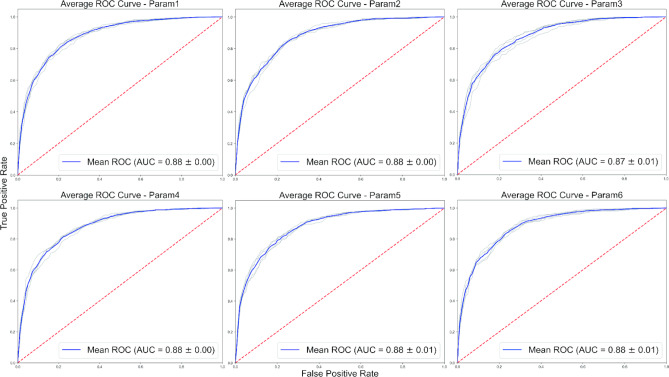
Due to the diverse molecular structures of chemical compounds and their intricate biological pathways of toxicity, predicting their reproductive and developmental toxicity remains a challenge. Traditional Quantitative Structure-Activity Relationship models that rely on molecular descriptors have limitations in capturing the complexity of reproductive and developmental toxicity to achieve high predictive performance. In this study, we developed a descriptor-free deep learning model by constructing a Graph Convolutional Network designed with multi-head attention and gated skip-connections to predict reproductive and developmental toxicity. By integrating structural alerts directly related to toxicity into the model, we enabled more effective learning of toxicologically relevant substructures. We built a dataset of 4,514 diverse compounds, including both organic and inorganic substances. The model was trained and validated using stratified 5-fold cross-validation. It demonstrated excellent predictive performance, achieving an accuracy of 81.19% on the test set. To address the interpretability of the deep learning model, we identified subgraphs corresponding to known structural alerts, providing insights into the model's decision-making process. This study was conducted in accordance with the OECD principles for reliable Quantitative Structure-Activity Relationship modeling and contributes to the development of robust in silico models for toxicity prediction.
Keywords: Graph convolutional networks; Quantitative structure-activity relationship (QSAR); Reproductive and developmental toxicity; Toxicity prediction.
© 2025. The Author(s).
Conflict of interest statement
Declarations. Competing interests: The authors declare no competing interests.
Figures
Similar articles
-
QSAR modeling without descriptors using graph convolutional neural networks: the case of mutagenicity prediction.Mol Divers. 2021 Aug;25(3):1283-1299. doi: 10.1007/s11030-021-10250-2. Epub 2021 Jun 19. Mol Divers. 2021. PMID: 34146224
-
FGTN: Fragment-based graph transformer network for predicting reproductive toxicity.Arch Toxicol. 2024 Dec;98(12):4077-4092. doi: 10.1007/s00204-024-03866-4. Epub 2024 Sep 18. Arch Toxicol. 2024. PMID: 39292235
-
Exploration of chemical space with partial labeled noisy student self-training and self-supervised graph embedding.BMC Bioinformatics. 2022 May 2;23(Suppl 3):158. doi: 10.1186/s12859-022-04681-3. BMC Bioinformatics. 2022. PMID: 35501680 Free PMC article.
-
Quantitative Structure Activity/Toxicity Relationship through Neural Networks for Drug Discovery or Regulatory Use.Curr Top Med Chem. 2023;23(29):2792-2804. doi: 10.2174/0115680266251327231017053718. Curr Top Med Chem. 2023. PMID: 37867278 Review.
-
Safety and nutritional assessment of GM plants and derived food and feed: the role of animal feeding trials.Food Chem Toxicol. 2008 Mar;46 Suppl 1:S2-70. doi: 10.1016/j.fct.2008.02.008. Epub 2008 Feb 13. Food Chem Toxicol. 2008. PMID: 18328408 Review.
References
-
- Brent, R. L. Teratology in the 20th century environmental causes of congenital malformations in humans and how they were established. Neurotoxicol Teratol 26, 1–12. 10.1016/j.ntt.2003.09.002 (2004). - PubMed
-
- Richburg, J. H. The relevance of spontaneous- and chemically-induced alterations in testicular germ cell apoptosis to toxicology. Toxicol. Lett.112–113, 79–86. 10.1016/S0378-4274(99)00253-2 (2000). - PubMed
-
- Tan, H. et al. Development, validation, and application of a human reproductive toxicity prediction model based on adverse outcome pathway. Environ. Sci. Technol.56, 12391–12403. 10.1021/acs.est.2c02242 (2022). - PubMed
MeSH terms
Grants and funding
LinkOut - more resources
Full Text Sources
