

Spatiotemporal dynamics and driving factors of human resources for health in traditional Chinese medicine in China
- PMID: 40415058
- PMCID: PMC12104421
- DOI: 10.1038/s41598-025-02615-6
Spatiotemporal dynamics and driving factors of human resources for health in traditional Chinese medicine in China
Abstract
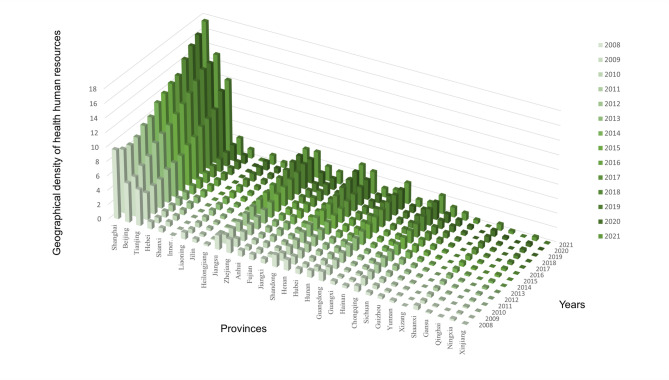
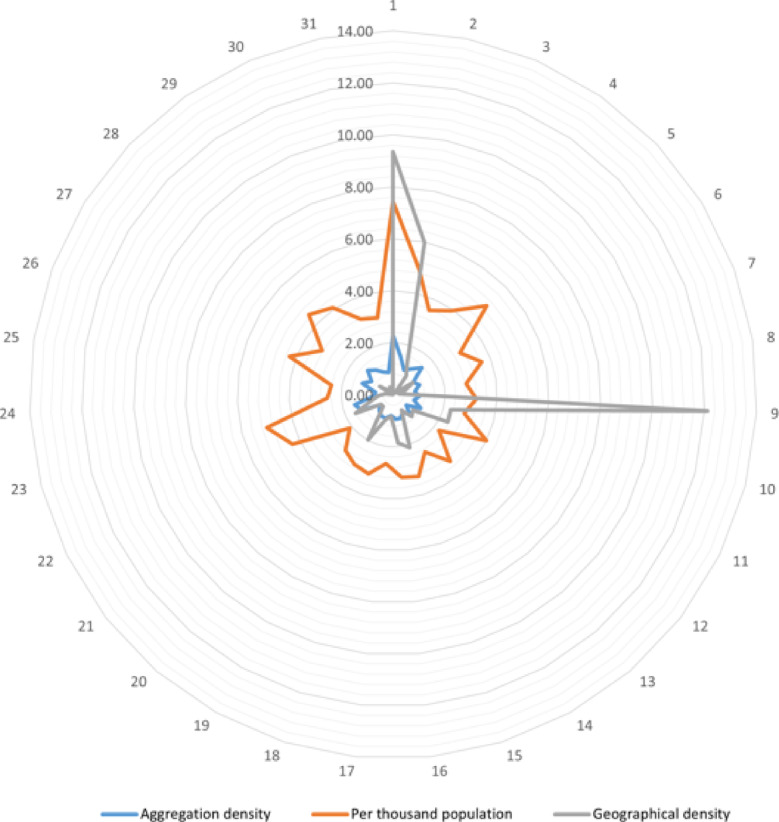
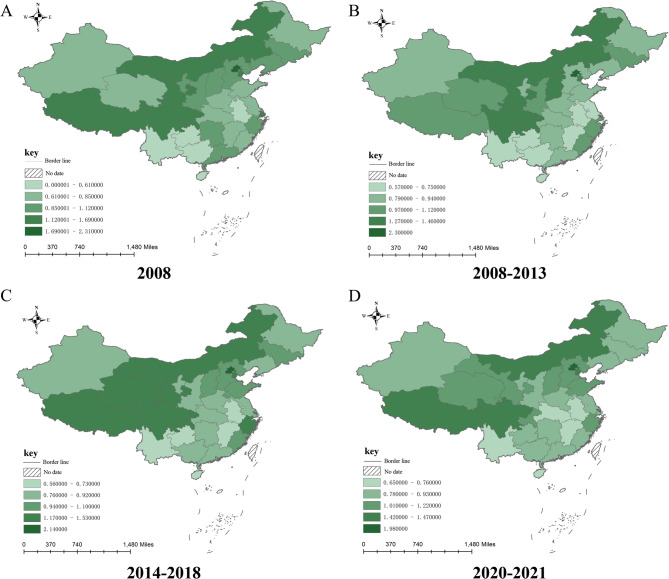
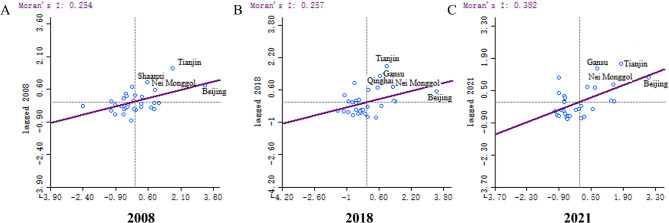
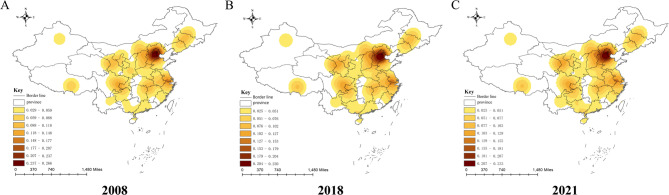
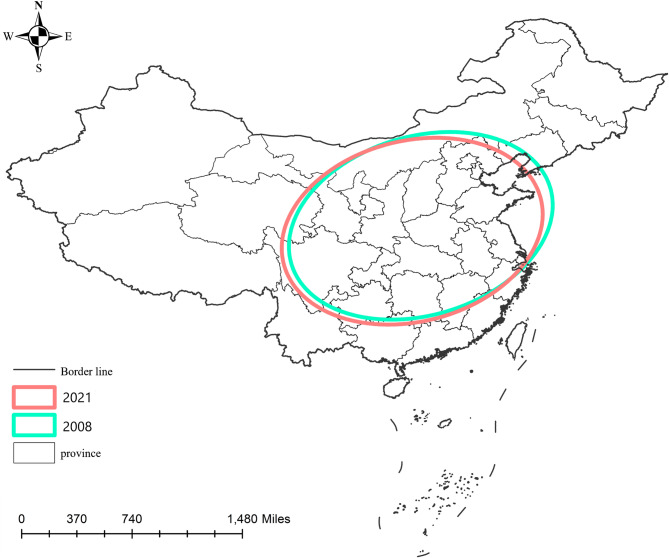
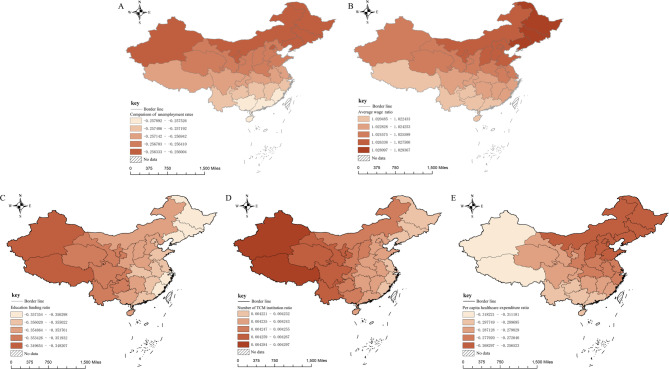
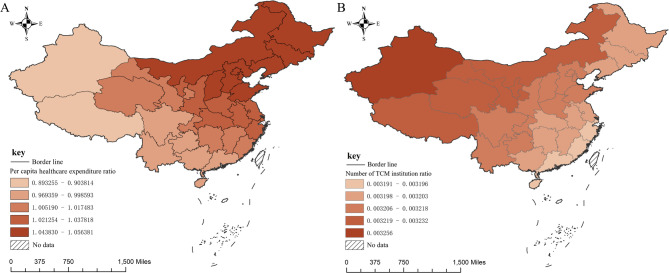
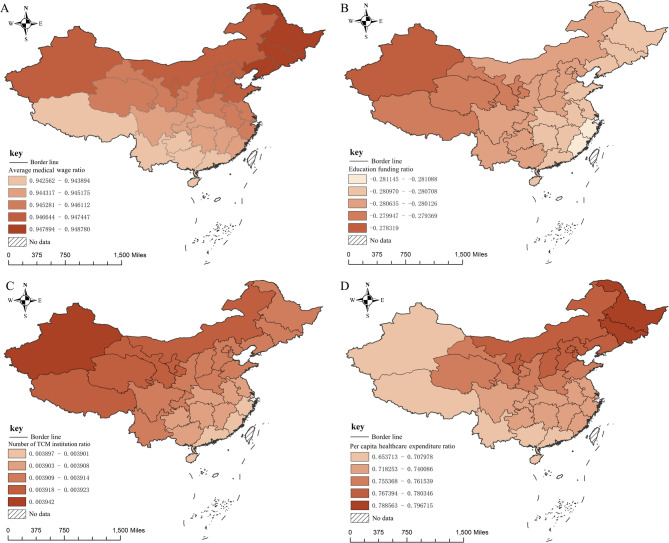
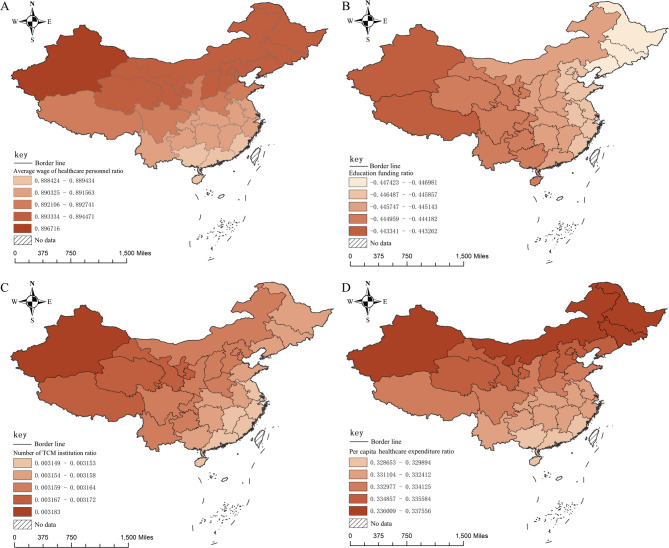
The uneven distribution of human resources for health (HRH) in China, particularly within the realm of traditional Chinese medicine (TCM), has long posed a significant challenge. Although prior studies have examined regional disparities in overall HRH, limited research has specifically addressed the spatial and temporal dynamics of HRH in TCM and their underlying determinants. This study employs a multiscale geographically weighted regression (MGWR) model to explore the spatial and temporal dynamics of HRH in TCM across 31 Chinese provinces from 2008 to 2021. MGWR allows each explanatory variable to operate at its optimal spatial scale, capturing localized patterns of spatial heterogeneity. The results reveal that although HRH in TCM has generally increased over time, substantial disparities persist, with eastern and central regions exhibiting a higher degree of resource agglomeration while western regions continue to lag behind. Economic factors such as wage income, the number of TCM institutions, and education funding emerge as the most significant and spatially heterogeneous determinants. These localized effects suggest that region-specific policy interventions are needed-such as financial incentives and infrastructure support for underserved western regions, and institutional integration and quality standardization in eastern areas-reflecting the differentiated roles and development contexts of TCM across regions. By leveraging the advantages of MGWR in capturing multiscale spatial patterns, this study provides empirical evidence to support more targeted and sustainable planning for HRH in TCM development. Enhancing the accessibility of TCM services not only addresses current regional imbalances but also strengthens the healthcare system's capacity to respond to the needs of an aging population and future public health emergencies. The findings offer valuable insights for policymakers aiming to improve health equity in China and may inform similar efforts in other countries facing spatial disparities in traditional medicine resources.
Keywords: Human resources for health; Regional disparities spatiotemporal analysis; Traditional Chinese medicine.
© 2025. The Author(s).
Conflict of interest statement
Declarations. Competing interests: The authors declare no competing interests.
Figures
Similar articles
-
Interprovincial spatial distribution patterns and socioeconomic factors on traditional Chinese medicine (TCM) service utilization in China.Soc Sci Med. 2024 Jul;353:117046. doi: 10.1016/j.socscimed.2024.117046. Epub 2024 Jun 8. Soc Sci Med. 2024. PMID: 38878594
-
Trends in the disparities and equity of the distribution of traditional Chinese medicine health resources in China from 2010 to 2020.PLoS One. 2022 Oct 10;17(10):e0275712. doi: 10.1371/journal.pone.0275712. eCollection 2022. PLoS One. 2022. PMID: 36215249 Free PMC article.
-
Equity and prediction of health resource allocation of traditional Chinese medicine in China.PLoS One. 2023 Aug 24;18(8):e0290440. doi: 10.1371/journal.pone.0290440. eCollection 2023. PLoS One. 2023. PMID: 37616267 Free PMC article.
-
The 2023 Latin America report of the Lancet Countdown on health and climate change: the imperative for health-centred climate-resilient development.Lancet Reg Health Am. 2024 Apr 23;33:100746. doi: 10.1016/j.lana.2024.100746. eCollection 2024 May. Lancet Reg Health Am. 2024. PMID: 38800647 Free PMC article. Review.
-
Current situation and countermeasures of traditional Chinese medicine resource distribution: a case study of Wuyi County in China.Front Public Health. 2025 Apr 17;13:1473833. doi: 10.3389/fpubh.2025.1473833. eCollection 2025. Front Public Health. 2025. PMID: 40313505 Free PMC article. Review.
Cited by
-
Regional disparities, dynamic evolution, and spatial spillover effects of medical resource allocation efficiency in TCM hospitals.Cost Eff Resour Alloc. 2025 Jul 18;23(1):35. doi: 10.1186/s12962-025-00644-6. Cost Eff Resour Alloc. 2025. PMID: 40682090 Free PMC article.
References
-
- Haakenstad, A. et al. Measuring the availability of human resources for health and its relationship to universal health coverage for 204 countries and territories from 1990 to 2019: a systematic analysis for the global burden of disease study 2019. Lancet399 (10341), 2129–2154 (2022). - PMC - PubMed
-
- World health statistics. monitoring health for the SDGs, sustainable development goals[EB/OL]. https://www.who.int/publications/i/item/9789240094703 (2024).
MeSH terms
LinkOut - more resources
Full Text Sources
