

Heterogeneity in mortality risk prediction: a study of vulnerable adults in the Canadian longitudinal study on aging
- PMID: 40415079
- PMCID: PMC12104110
- DOI: 10.1007/s40520-025-03063-y
Heterogeneity in mortality risk prediction: a study of vulnerable adults in the Canadian longitudinal study on aging
Abstract
Background: Mortality prediction models are essential for clinical decision-making, but their performance may vary across patient subgroups. This study aimed to evaluate how a general mortality prediction model performs across subgroups defined by vulnerability factors and to test whether model improvements could improve prediction accuracy.
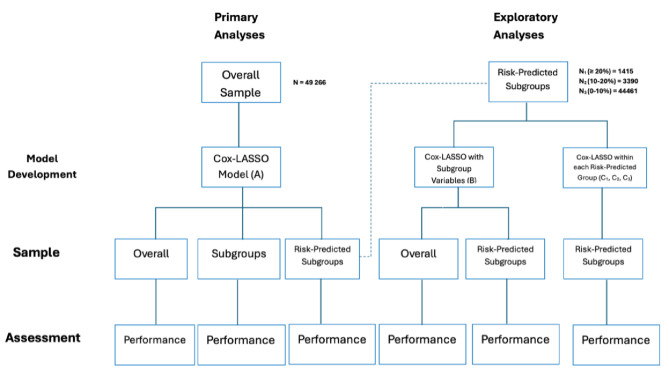
Methods: We analyzed data from 49,266 participants in the Canadian Longitudinal Study on Aging. A general mortality prediction model (Model A) was developed using Cox proportional hazard regression with LASSO, incorporating variables spanning sociodemographic factors, lifestyle habits, comorbidities, and physical/cognitive function measures. Performance was evaluated across subgroups defined by age, frailty, multimorbidity, cognitive function, and functional impairment using discrimination (c-index), calibration, and Brier scores. We tested two additional strategies: incorporating subgroup-specific variables (Model B) and developing tailored models for different mortality risk categories (Models C1, C2, C3).
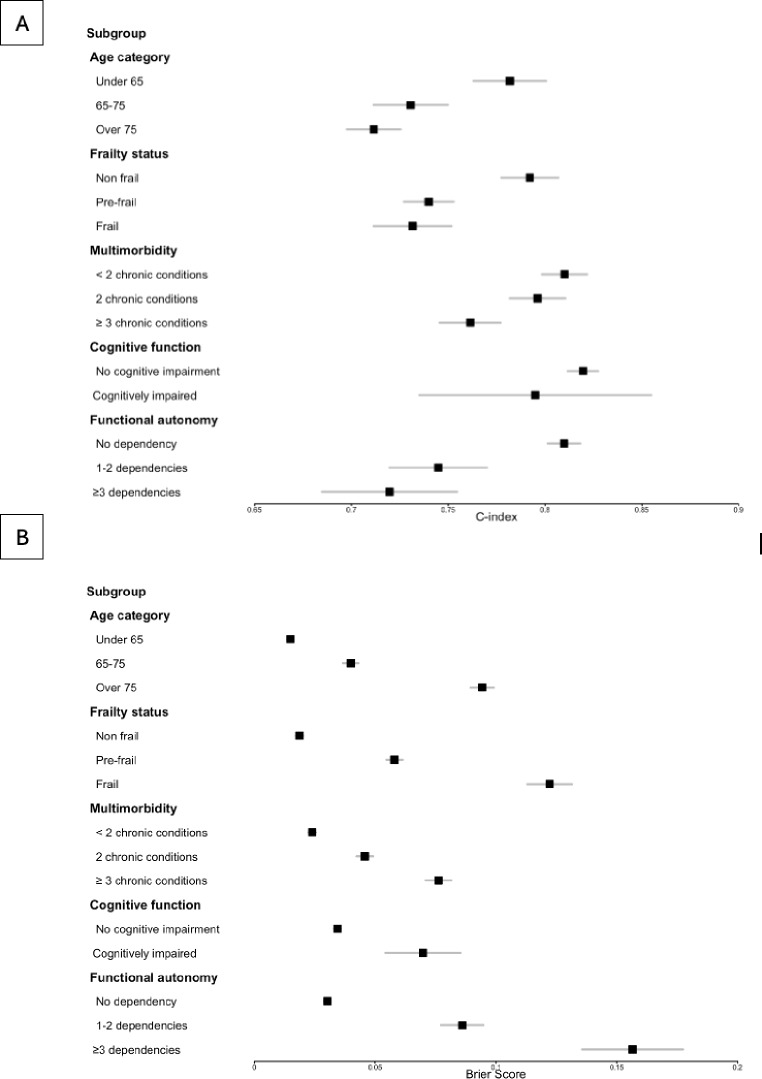
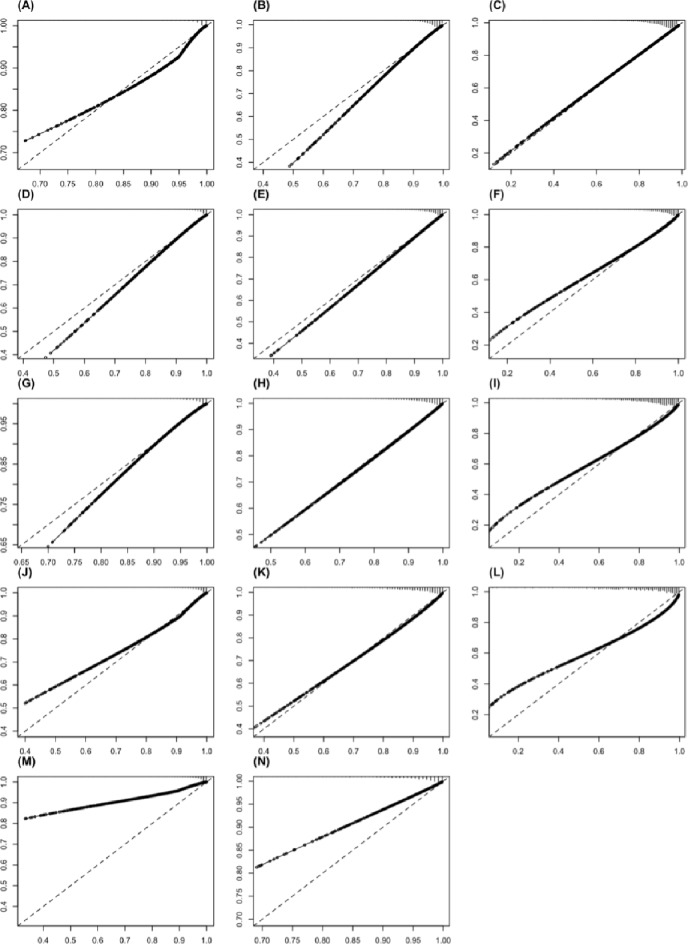
Results: Over a median 6-year follow-up, 7.5% (3672) participants died. The general model performed well overall (c-index: 0.82, 95% CI 0.80-0.84; Brier: 0.036, 95% CI 0.032-0.040), but performance varied across subgroups. It was lower in frail individuals (c-index: 0.73, 95% CI 0.71-0.75; Brier: 0.12, 95% CI 0.11-0.13) and those with multiple chronic conditions (c-index: 0.76, 95% CI 0.75-0.78; Brier: 0.08, 95% CI 0.07-0.08), with risk underestimated in these groups. Neither incorporating subgroup variables nor developing risk-stratified models significantly improved performance.
Conclusion: Important variability in performance, particularly in vulnerable groups, highlights the limitations of a one-size-fits-all and underscores the need for more granular predictive models that account for subpopulation-specific characteristics to enhance mortality risk prediction.
Keywords: Aging population; CLSA; Health outcomes; Mortality prediction; Personalized medicine.
© 2025. The Author(s).
Conflict of interest statement
Declarations. Ethics approval: This study was approved by the Research Ethics Board of the Centre hospitalier de l’Université de Montréal (2024–12123, 23.309– LM). The procedures used in this study adhere to the tenets of the Declaration of Helsinki. Competing interests: The authors declare no competing interests. Disclaimer: The opinions expressed in this manuscript are the author’s own and do not reflect the views of the Canadian Longitudinal Study on Aging.
Figures
Similar articles
-
Development and validation of a predictive model for frailty risk in older adults with cardiovascular-metabolic comorbidities.Front Public Health. 2025 Apr 22;13:1561845. doi: 10.3389/fpubh.2025.1561845. eCollection 2025. Front Public Health. 2025. PMID: 40331117 Free PMC article.
-
Joint association of frailty index and biological aging with all-cause and cause-specific mortality: a population-based longitudinal cohort study.Arch Gerontol Geriatr. 2025 Jul;134:105856. doi: 10.1016/j.archger.2025.105856. Epub 2025 Apr 9. Arch Gerontol Geriatr. 2025. PMID: 40228393
-
Development and Validation of Mortality Prediction Models among Frail Participants in the UK Biobank Study.J Gerontol A Biol Sci Med Sci. 2025 Jun 10;80(7):glaf096. doi: 10.1093/gerona/glaf096. J Gerontol A Biol Sci Med Sci. 2025. PMID: 40326431
-
Using Predictive Models to Improve Care for Patients Hospitalized with COVID-19 [Internet].Washington (DC): Patient-Centered Outcomes Research Institute (PCORI); 2023 Jan. Washington (DC): Patient-Centered Outcomes Research Institute (PCORI); 2023 Jan. PMID: 38976624 Free Books & Documents. Review.
-
Folic acid supplementation and malaria susceptibility and severity among people taking antifolate antimalarial drugs in endemic areas.Cochrane Database Syst Rev. 2022 Feb 1;2(2022):CD014217. doi: 10.1002/14651858.CD014217. Cochrane Database Syst Rev. 2022. PMID: 36321557 Free PMC article.
References
-
- Barbazzeni B, Friebe M, Prevention (2022) Prediction, Personalization, and Participation as Key Components in Future Health. In: Friebe M, editor. Novel Innovation Design for the Future of Health [Internet]. Cham: Springer International Publishing; [cited 2024 Feb 17]. pp. 147–52. Available from: https://link.springer.com/10.1007/978-3-031-08191-0_14
-
- Nong P, Raj M, Platt J (2022) Integrating predictive models into care: facilitating informed decision-making and communicating equity issues. Am J Manag Care 28(1):18–24 - PubMed
MeSH terms
LinkOut - more resources
Full Text Sources
Medical
Miscellaneous
